Fourier Series Visualisation in SwiftUI
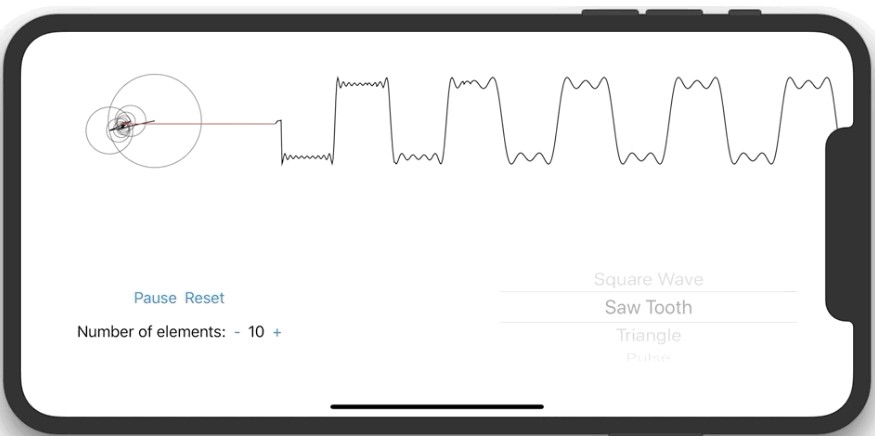
This little app visualises different Fourier series using epicycles and a graph.
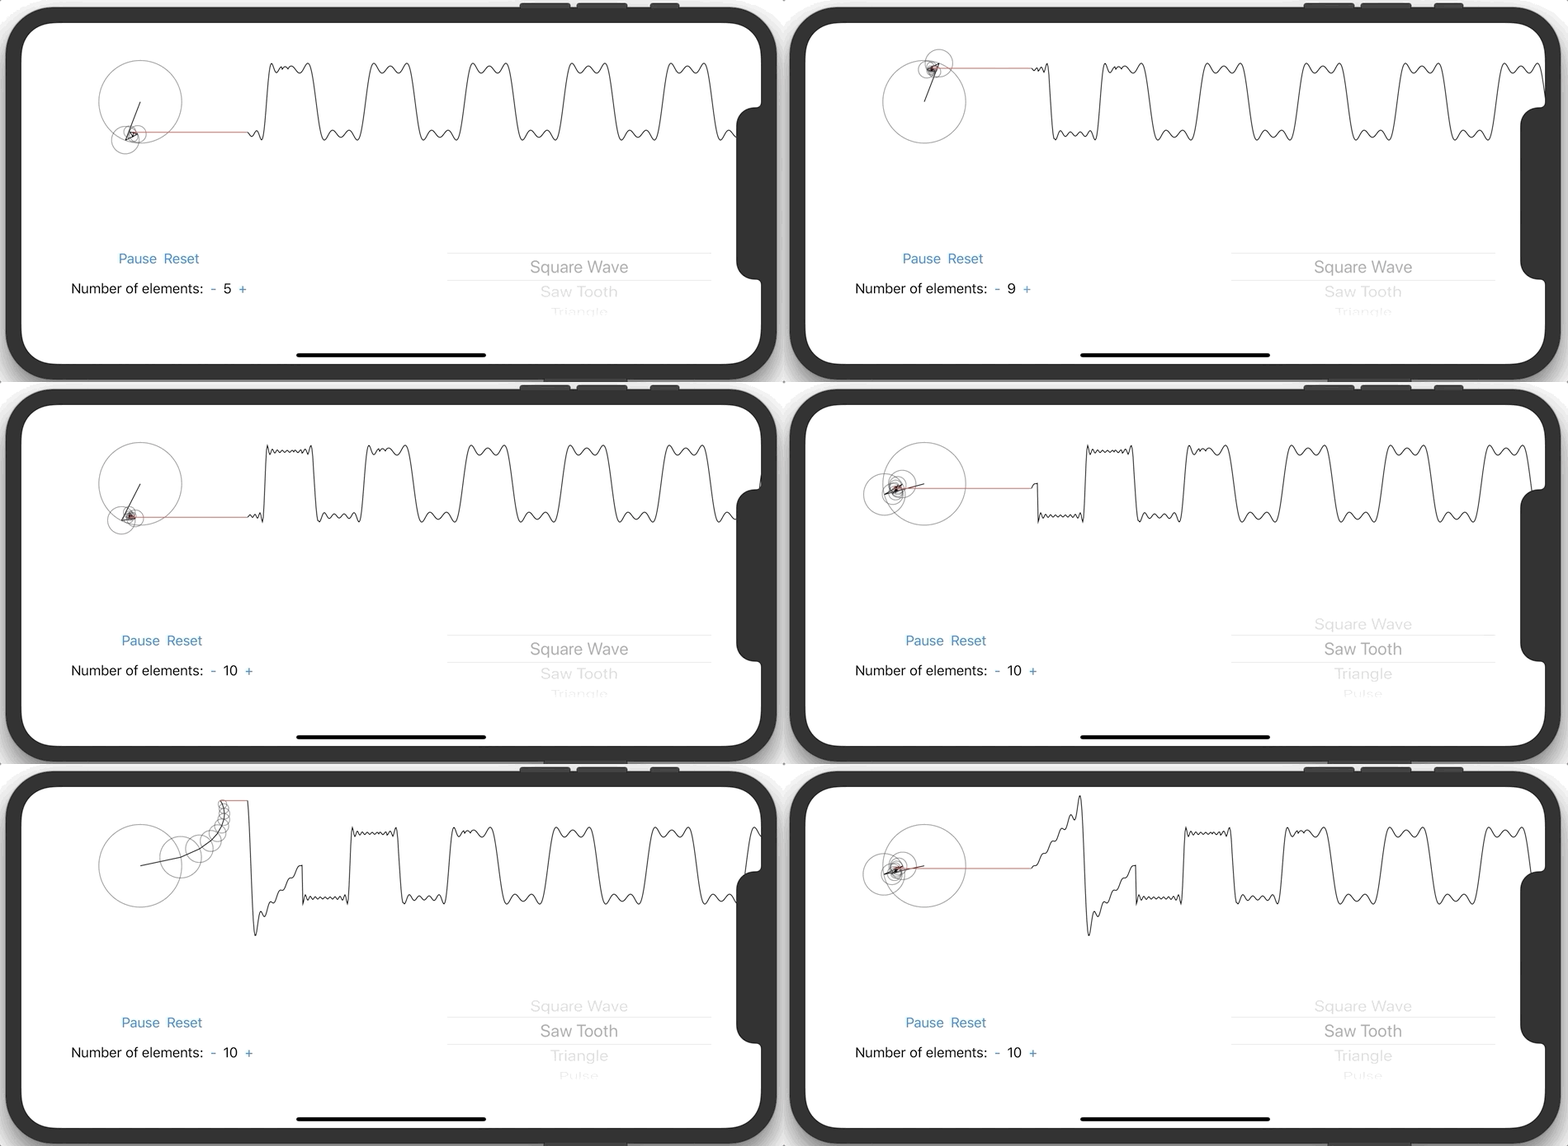
The number of functions and the type of series can be changed. The following series are supported:
- Square Wave
- Saw Tooth
- Triangle
- Pulse
It builds and runs on iOS and macOS using Catalyst.
I started this little project to familiarise myself a bit more with SwiftUI and its drawing APIs. It is not meant to be perfect SwiftUI and I am sure there are probably better ways of doing things. Any feedback is appreciated!
