MuVis-v2.1
MuVis is a Swift Multiplatform (macOS & iOS) app for real-time music visualization. “See what notes they’re playing.”
New in MuVis v2.1:
- 29 visualizations (each with 2 options) consolidated into 24 visualizations (each with 4 options).
- Swipe left/right to change displayed visualizations. Swipe up/down to changes each’s option.
- Triple tap to show/hide toolbars (on iOS). Triple tap to enable BlackHole playback (on macOS).
- Numerous small changes to improve code readability and performance.
MuVis is an open-source multi-platform app (using SwiftUI, Swift, and Xcode) for music visualization. It renders informative (and musically useful) graphical displays in real time from music files being played – or from the device’s microphone. Further details are provided in the project’s User Guide and Visualizations Guide documents.
This app runs on macOS, iOS, and iPadOS devices. The latest release can be downloaded from the Apple App Store (here). And the source code can be downloaded (here) . MuVis uses the BASS audio library from (here) .
Real-time music visualization is an exciting endeavor – providing the user with dynamic visual and aural stimulation and edification. I am hoping that others will benefit from my research – and perhaps build upon what I have started. I will strive to continuously improve this app as time allows.
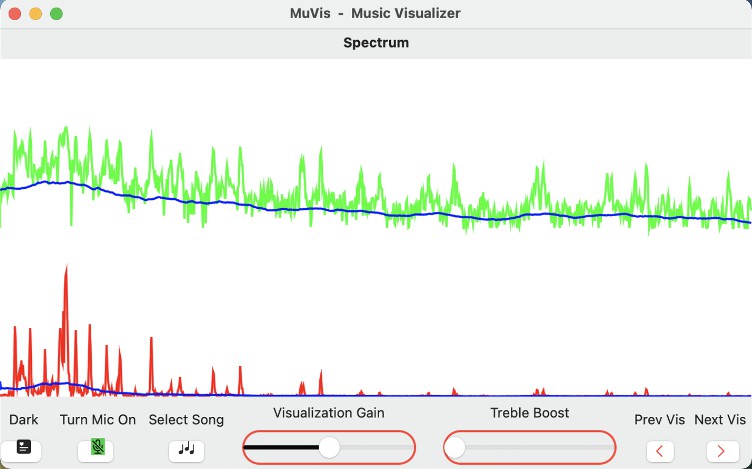
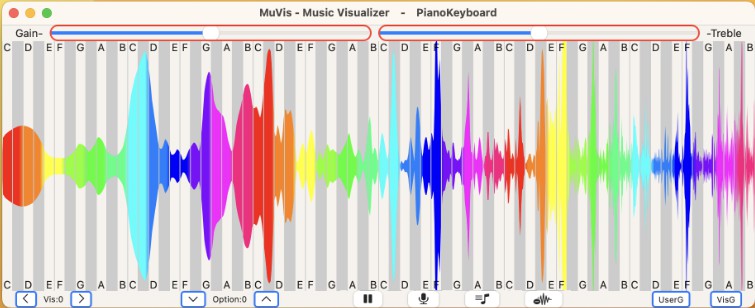
When the MuVis app first opens, the on-screen display should look somewhat like:

and the computer’s speakers should be playing music from a pre-loaded royalty-free music file. (Currently, the song file is “The Elevator Bossa Nova” from Bensound.com.) The on-screen display shows a real-time dynamic visual representation of the audio that you are hearing.
On your Mac, click-and-drag any corner of this window to freely re-size it to any width and height you wish.
On a Mac, the menu bar at the top shows the app’s title “MuVis (Music Visualizer)” followed by the name “Spectrum” of the particular visualization selected for display. On an iPhone or iPad, the menu bar is not displayed.
The top and bottom toolbars contains buttons and sliders to allow you to control what you see.
At the bottom left are two buttons labelled by left- and right-chevrons. Clicking the left one changes the display to the previous visualization, and clicking the right one changes the display to the next visualization – which allows you to cycle through the twenty-four visualizations currently provided by the app. On a Mac, as a convenient keyboard-shortcut, you also can simply use the left-arrow and right-arrow keyboard keys to cycle back-and-forth among these visualizations. On your iPhone or iPad, you can simply swipe left or right to change the visualization.
Adjacent to these Visualization chevrons are two Option chevrons. Clicking the downward-pointing one changes the display to the previous option, and clicking the upward-pointing one changes the display to the next option. When programming these visualization algorithms, there are numerous variations and options available to the developer. This button allows the user to select to see any of four variations. The particular variation rendered is different for each visualization. The user should check out the option for each visualization to see which she likes. On a Mac, as a convenient keyboard-shortcut, you also can simply use the up-arrow and down-arrow keyboard keys to cycle among these options. On your iPhone or iPad, you can simply swipe up or down to change the option rendered.
Adjacent to these Option chevrons is a “Pause” button. When clicked, it stops the music playback and freezes the visualization display. The button icon changes to “Play” which, when clicked, causes the music playback and the visualization display to continue.
The adjacent button has a “Microphone” icon. When pressed it stops playing the audio from the selected song file (and also stops it’s visualization), and starts playing the live audio from the microphone (and starts it’s visualization). The icon then becomes a slashed-microphone – which, when pressed, performs the reverse actions and changes the icon back to “Microphone”.
The next button has a “Music List” icon. (It is disabled and grayed-out if the microphone is enabled.) When the button is clicked, a sub-window pops up to enable the selection of a song to play. On a Mac, it allows you to select whatever songs you want from your own Music folder. Unfortunately, on an iPhone or iPad, the pop-up window allows access only to songs loaded into your iCloud Drive folder (called “Files” in iOS.). (Apple allows only its own Music app to have access to songs in the iPhone or iPad music library.)
The adjacent button has a “Waveform” icon with a minus sign. When clicked, it passes the audio signal through a “spectral enhancer” filter which reduces the display of noise (usually percussive effects which smear spectral energy over a large frequency range), and enhances the display of spectral lines (usually the harmonics of musical notes). The icon then becomes a normal “Waveform” (without the minus sign) which, when clicked, removes the enhancing filter. (Note that this enhancement applies only to the visual display, not to the audio you are hearing.)
Finally, at the right end of the bottom toolbar are two buttons labelled UserG (for User Guide) and VisG (for Visualizations Guide). Clicking either button activates a “Quick Look” popup window to display the app’s documentation. The User Guide (the document you are currently reading) explains the functionality of the app’s user interface. The Visualizations Guide describes the purpose of each visualization – probably in more detail than you want.
The top toolbar contains two sliders – one controlling “Visualization Gain” and the other controlling “Visualization Treble Boost”. As their names imply, sliding them adjusts the gain and slope of the visual data representation. (Note that they do NOT adjust the audio levels of the music your are hearing.) They allow subjectively adjusting the display to be the most pleasing – despite whether the musical passage is very quiet or very loud.