Tree Dump Debugger
A visual developer tool for inspecting your iOS application data structures.


Features
Inspect any data structure with only one line of code:
TreeDumpDebugger.present(["foo": "bar", 122: [122, 45, 4]])
Or from a SwiftUI view:
Button("Press me") {
    showSwiftUIModal = true
}.sheet(isPresented: $showSwiftUIModal) {
    TreeDumpDebugger.makeSwiftUIView(with: ["foo": "bar", 122: [122, 45, 4]])
}
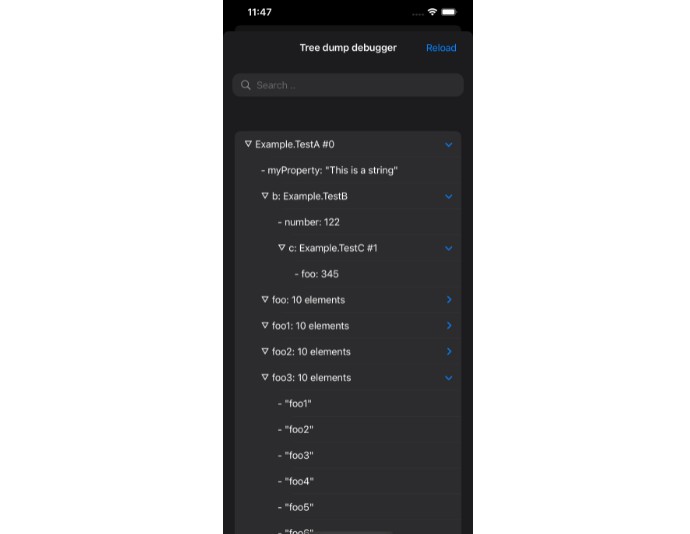
You can modify any node in the tree, can be useful if you want different formatting or hide sensitive data:
struct TestB {
    var number: Int
}
class TestA {
    init(myProperty: String, b: TestB) {
        self.myProperty = myProperty
        self.b = b
    }
    var myProperty: String
    let b: TestB
}

let data = TestA(myProperty: "This is a string", b: TestB(number: 122))

TreeDumpDebugger.present(data) { string in
    if let range = string.range(of: "This is a string") {
        return string.replacingCharacters(in: range, with: "Still a string but changed")
    }
    return string
}

TreeDumpDebugger.present(data) { string in
    return string.replacingOccurrences(of: "▿", with: "?")
}
How does it work?
Tree Dump Debugger parses indented output into a tree structure. It uses Swift’s built dump function by default. No private APIs are used.
If you want to use another dumping tool it’s possible to do so by conforming to the TreeDumpRepresentable protocol.
public protocol TreeDumpRepresentable {
    func makeLine(string: String, lineOutput: (String) -> Void)
    func dump(using tree: inout TreeDumpDebugger.Tree)
}
So if we for instance would like to use swift-custom-dump which is another great dumping tool:
import CustomDump

struct CustomDump<T>: TreeDumpRepresentable {
    let value: T
    var name: String? = nil
    var indent: Int = 0
    var maxDepth: Int = .max

    func makeLine(string: String, lineOutput: (String) -> Void) {
        let lines = string.components(separatedBy: .newlines)
        for line in lines {
            lineOutput(line)
        }
    }

    func dump(using tree: inout TreeDumpDebugger.Tree) {
        customDump(value, to: &tree, name: name, indent: indent, maxDepth: maxDepth)
    }

}

TreeDumpDebugger.present(CustomDump(value: data))
Installation
Simply drag and drop TreeDumpDebugger.swift into your project. Since this a debugging tool it’s probably a good idea to wrap the whole file in a #if DEBUG.
Why no Swift Package?
There is currently no support to conditionally embed a framework in Package.swift for a debug configuration, so a Swift Package would probably just do more harm than good.
Requirements
iOS 14
Other ways of using it
The repo also contains a LLDB script that can used to present the debugger view on the fly.
(lldb) tdump ["foo", "bar", 122, 3223]

To use the script add this line to your .lldbinit
command script import <path/to/script>
Or use lowmad
$ lowmad install https://github.com/bangerang/tree-dump-debugger.git