LineChartView
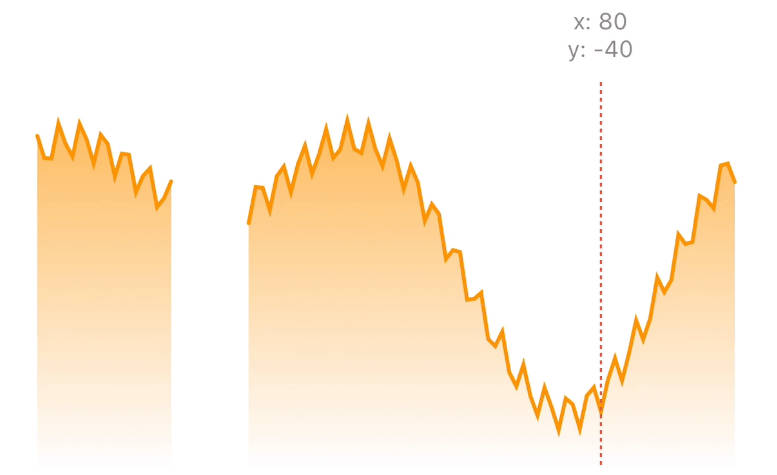
LineChartView is a Swift Package written in SwiftUI to add a line chart to your app. It has many available customizations and is interactive (user can move finger on line to get values details).
It is really easy to use and add to your app. It only takes an array of Double values as mandatory parameter. All other parameters are here to customize visual aspect and interactions.
Features
- Displays
Doublevalues in a line chart - Add labels to each value (as
String) - Change label (value) and secondary label colors
- Change labels alignment (left, center, right)
- Change indicator point color and size
- Change line color (simple color or linear gradient with two colors)
- Display dots for each point/value on line
- Enable/disable drag gesture
- Enable/disable haptic feedback when drag on exact value
- Use SwiftUI modifiers to custom chart (like background or frame size)
Installation
Add LineChartView package to your project.
In Xcode 13.1: File -> Add Packages... then enter my project GitHub URL:
https://github.com/Jonathan-Gander/LineChartView
Usage
Quick first chart
In file you want to add a chart:
import LineChartView
Then first create a LineChartParameters and set parameters to customize your brand new chart. Only first data parameter is mandatory to provide your values (as an array of Double):
let chartParameters = LineChartParameters(data: [42.0, 25.8, 88.19, 15.0])
Then create a LineChartView by passing your LineChartParameter:
LineChartView(lineChartParameters: chartParameters)
Complete example
Here is an example of a View displaying a chart with values and labels, and set its height:
import SwiftUI
import LineChartView

struct ContentView: View {

    private let data: [Double] = [42.0, 25.8, 88.19, 15.0]
    private let labels: [String] = ["The answer", "Birthday", "2021-11-21", "My number"]

    var body: some View {

        let chartParameters = LineChartParameters(data: data)
        LineChartView(lineChartParameters: chartParameters)
            .frame(height: 300)
    }
}
Customize your chart
To customize your chart, you can set parameters of LineChartParameters. Here are explanations of each parameter:
data: Array ofDoublecontaining values to displaydataLabels: Array ofStringcontaining label for each valuelabelColor: Color of values textsecondaryLabelColor: Color of labels textlabelsAlignment:.left,.center,.rightto align both labels above chartindicatorPointColor: Color of indicator point displayed when user drag finger on chartindicatorPointSize: Size of indicator pointlineColor: First color of linelineSecondColor: If set, will display a linear gradient from left to right fromlineColortolineSecondColorlineWidth: Line widthdotsWidth: Display a dot for each value (set to-1to hide dots)dragGesture: Enable or disable drag gesture on charthapticFeedback: Enable or disable haptic feedback on each value point
Example of a complete LineChartParameters:
let chartParameters = LineChartParameters(
    data: data,
    dataLabels: labels,
    labelColor: .primary,
    secondaryLabelColor: .secondary,
    labelsAlignment: .left,
    indicatorPointColor: .blue,
    indicatorPointSize: 20,
    lineColor: .blue,
    lineSecondColor: .purple,
    lineWidth: 3,
    dotsWidth: 8,
    dragGesture: true,
    hapticFeedback: true
)
I’m working on…
? Developer at work ?
- Animation when line is drawn
Licence
Be free to use my LineChartView Package in your app. Licence is available here. Please only add a copyright and licence notice.
Note that I’ve based my solution on stock-charts. I’ve totally modified and changed it but you may found similar code parts.