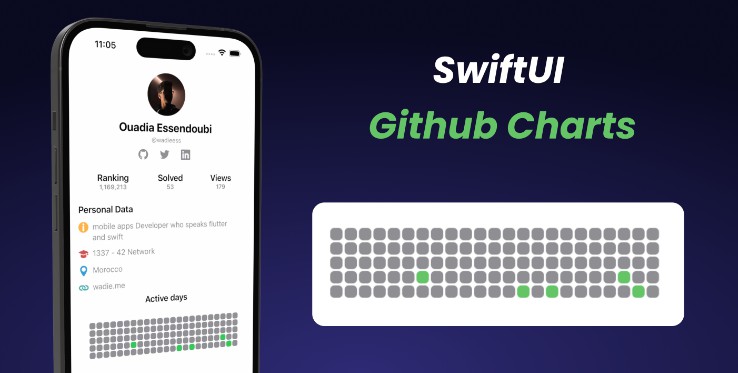
SwiftUI ContributionChartView

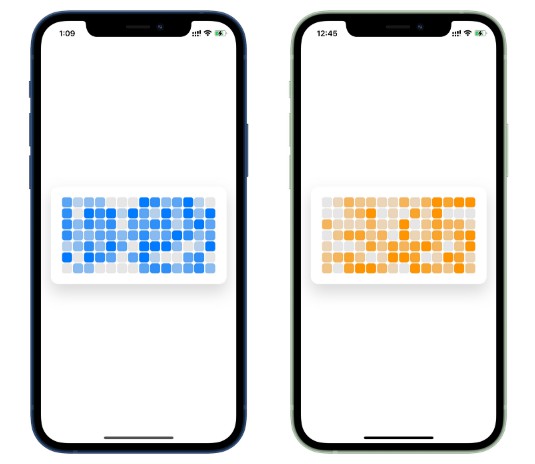
Contribution Chart View is a SwiftUI package that provides a customizable chart view to display contributions over a period of time, similar to GitHub’s contribution chart.

Features
- Visualize contributions with customizable colors.
- Adjustable number of days per row.
- Support for total days.
Requirements
- iOS 13.0+ / macOS 10.15+
- Xcode 11.0+
- Swift 5.0+
Installation
- Clone the repository:
- Open your Xcode project.
- Drag the ContributionChartView folder from Finder into your Xcode project.
- Ensure that the files are added to the appropriate target(s) in your project.
Usage
- Import the module:
import ContributionChartView
- Create an instance of ContributionChartView:
 let contributionData = [
   "2023-06-01": 4,
   "2023-06-02": 2,
   "2023-06-03": 9,
   // Add your contribution data here
]

let daysPerRow = 23
let totalDays = 90

let chartView = ContributionChartView(contributionData: contributionData, daysPerRow: daysPerRow, totalDays: totalDays)
- Use chartView in your SwiftUI view hierarchy:
     struct ContentView: View {
   var body: some View {
       VStack {
           // Your other views

           chartView

           // Your other views
       }
   }
}
Swift Package Manager
You can use the Swift Package Manager to install ContributionChartView by adding it as a dependency in your Package.swift file:
.package(url: "https://github.com/your-username/ContributionChartView.git", from: "1.0.0")
License
Feel free to use or to share this package as you want!