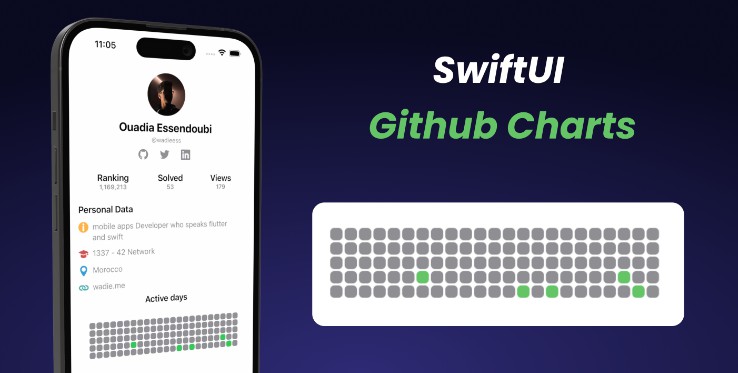
ContributionChart
A contribution chart (aka. heatmap, GitHub-like) library for iOS, macOS, and watchOS.
100% written in SwiftUI.


It Supports
Custom Block Number
Of course, you can also custom the size of blocks and spacing between blocks.


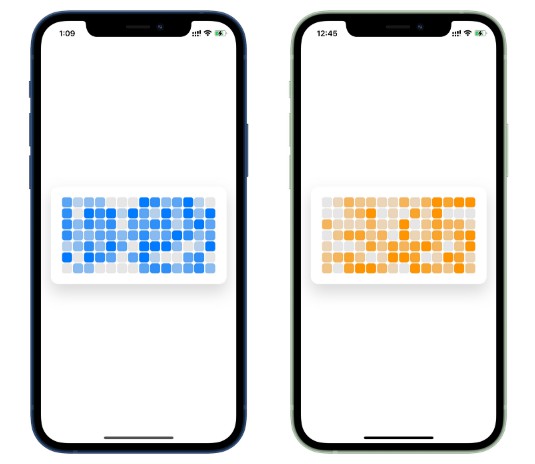
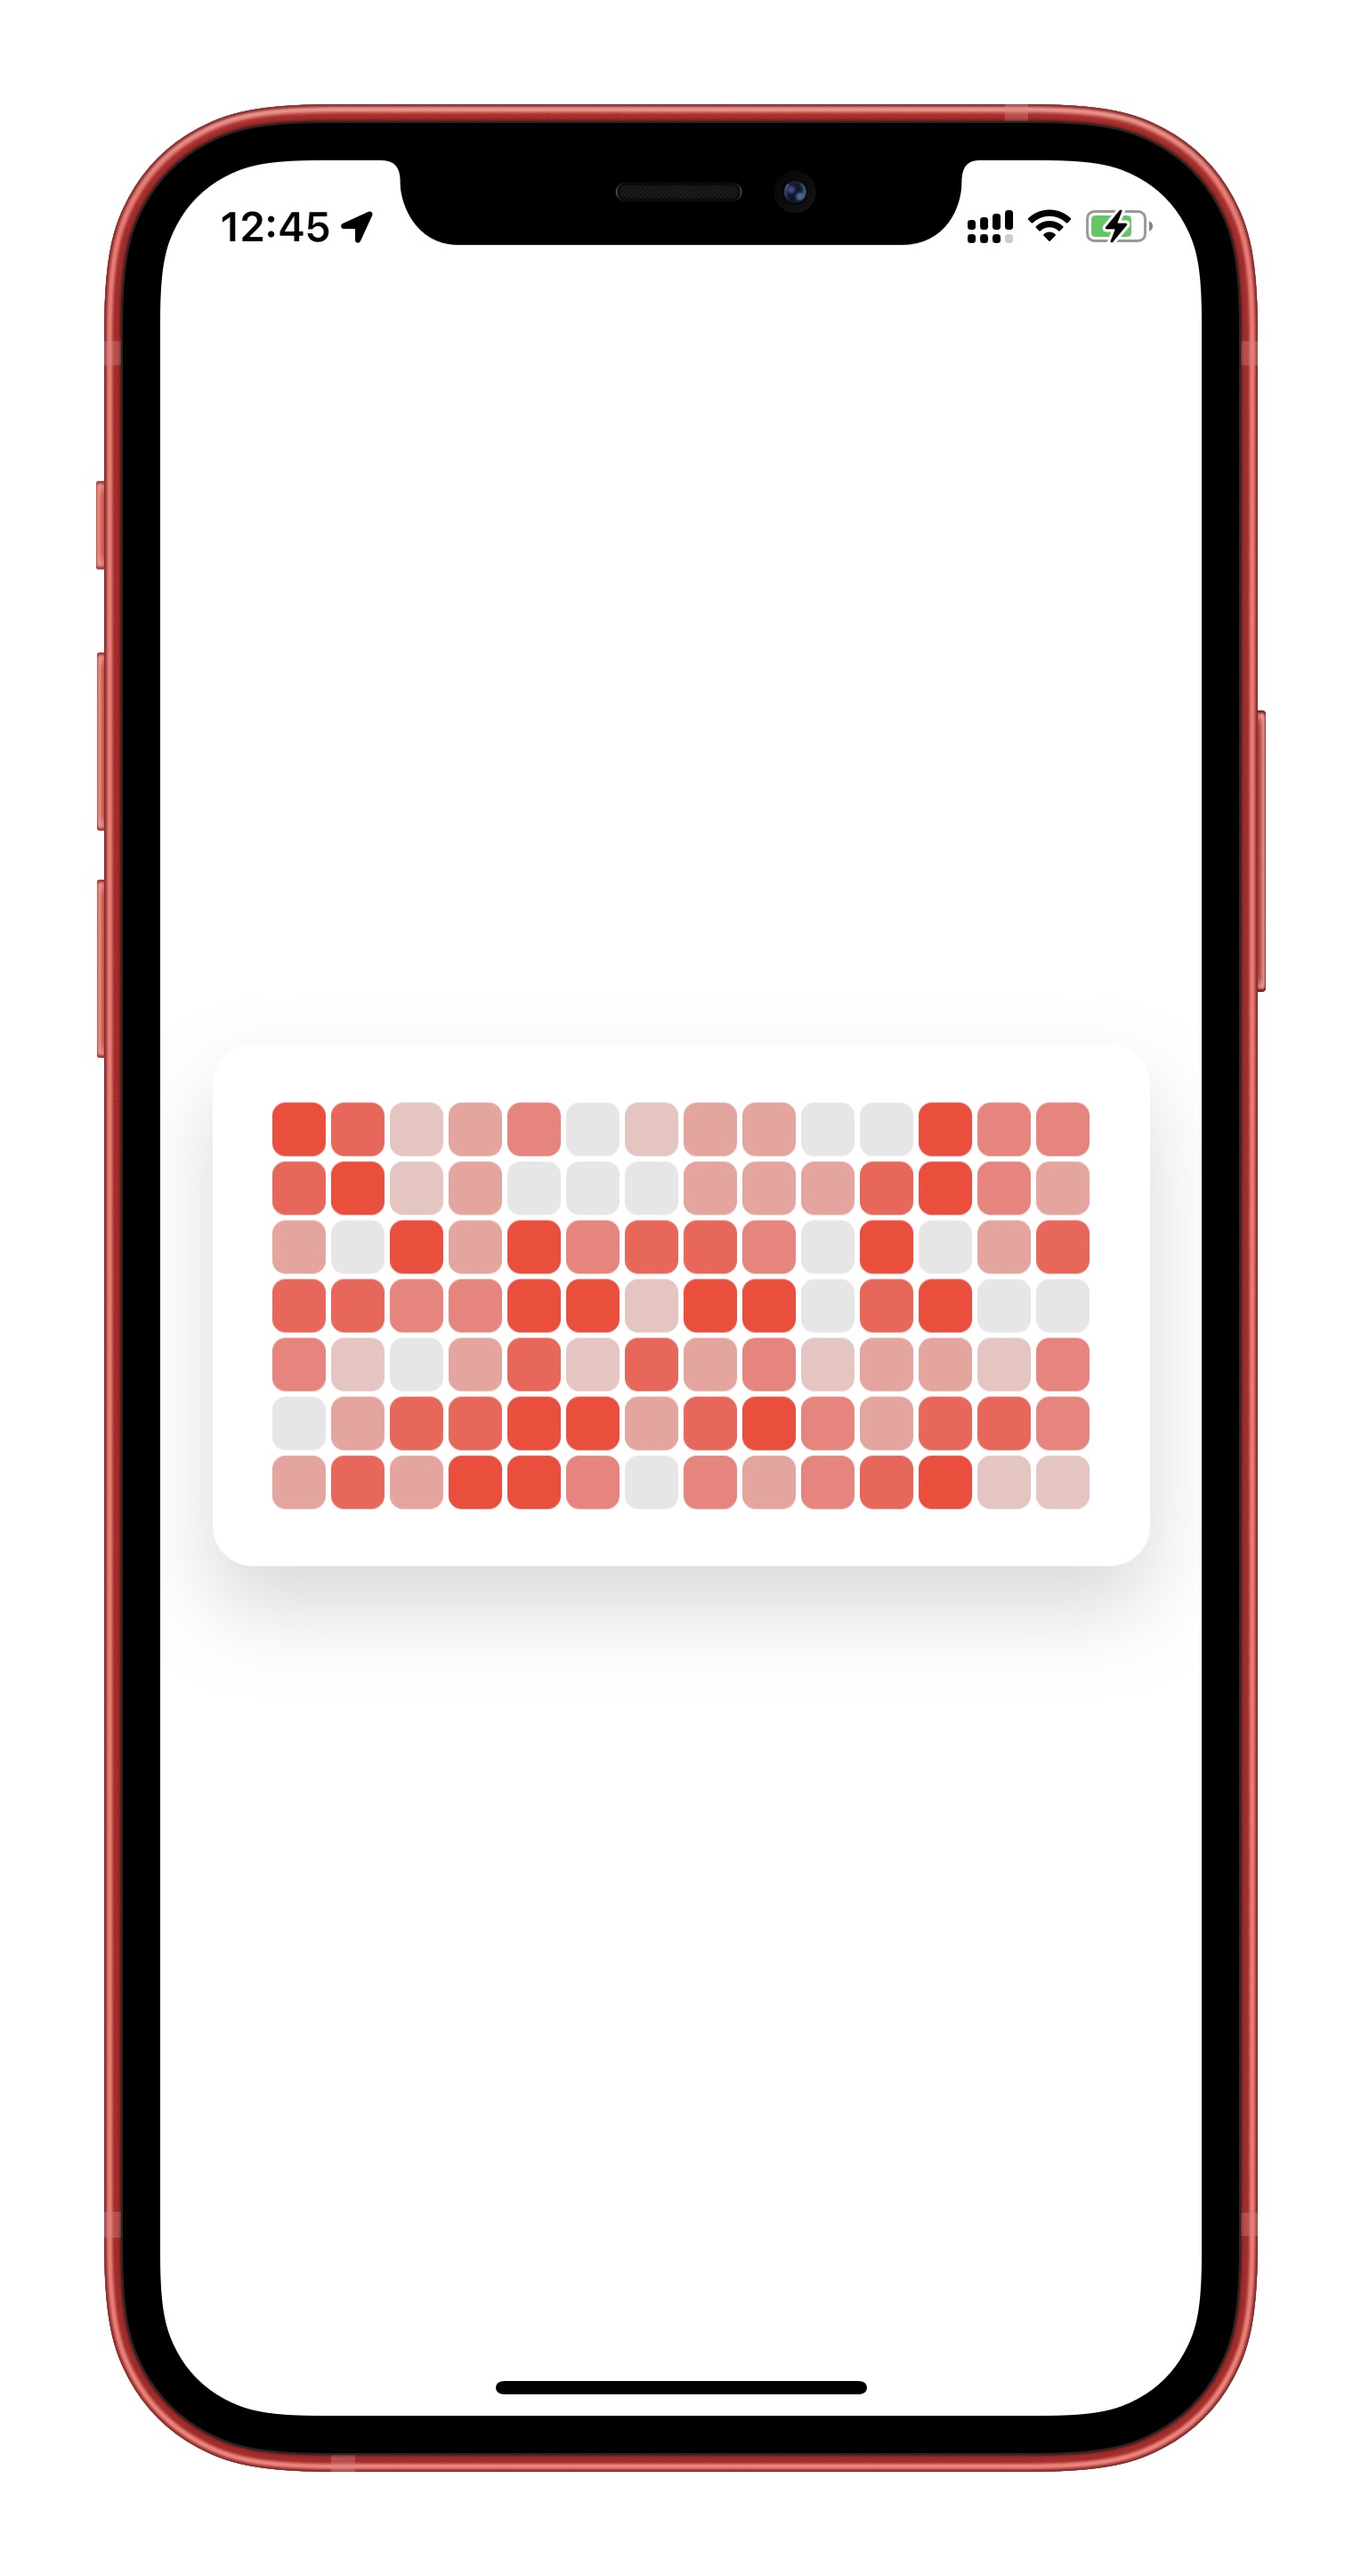
Custom Block Color
Here are examples using system colors as below, and you can custom any color you like.


Dark mode
Adjust to dark mode color automatically.

Installation
Require iOS 13, macOS 10.15, watchOS 6 and Xcode 11 or higher.
In Xcode go to File -> Swift Packages -> Add Package Dependency
and paste in the repo’s url:
https://github.com/VIkill33/SwiftUI-ContributionChart.git
Or you can download the code of this repo, then Add Local... in Xcode, and open the folder of the repo.
Usage
- Import this package after you installed by
import ContributionChart - Use the chart like
ContributionChartView(data: yourData,
                      rows: yourRows,
                      columns: yourColumns,
                      targetValue: yourTargetValue,
                      blockColor: .green)
Make sure that yourData (a double array) you pass has exactly yourRows * yourColumns numbers, and the targetValue is recommanded to set to the max value of the array.
The color of a block will appear as exactly the color as parameter blockColor when its value is equal to targetValue, and appears light gray when is equal to zero.
The top-Leading block represents the first value in array, while the bottom-trailing represents the last. And the order follows as below:

Demo Code
import SwiftUI
import ContributionChart

struct ContentView: View {
    var data: [Double]
    let rows = 7
    let columns = 14

    init() {
        data = [0.3, 0.4, 0.4, 0.4, 0.1, 0.5, 0.0, 0.1, 0.0, 0.2, 0.2, 0.2, 0.0, 0.2, 0.2, 0.5, 0.4, 0.2, 0.4, 0.5, 0.2, 0.2, 0.4, 0.3, 0.3, 0.2, 0.4, 0.0, 0.0, 0.5, 0.4, 0.3, 0.5, 0.3, 0.0, 0.0, 0.1, 0.0, 0.2, 0.3, 0.0, 0.0, 0.0, 0.5, 0.3, 0.3, 0.0, 0.3, 0.0, 0.5, 0.3, 0.3, 0.4, 0.5, 0.5, 0.3, 0.4, 0.1, 0.4, 0.2, 0.5, 0.1, 0.4, 0.2, 0.5, 0.4, 0.3, 0.5, 0.0, 0.4, 0.3, 0.2, 0.1, 0.5, 0.2, 0.0, 0.2, 0.5, 0.5, 0.3, 0.4, 0.0, 0.3, 0.3, 0.1, 0.2, 0.5, 0.2, 0.1, 0.4, 0.4, 0.0, 0.5, 0.3, 0.3, 0.5, 0.0, 0.2]
    }

    var body: some View {
                ContributionChartView(data: data,
                                      rows: rows,
                                      columns: columns,
                                      targetValue: 0.5,
                                      blockColor: .green)
        }
    }


struct ContentView_Previews: PreviewProvider {
    static var previews: some View {
        ContentView()
    }
}