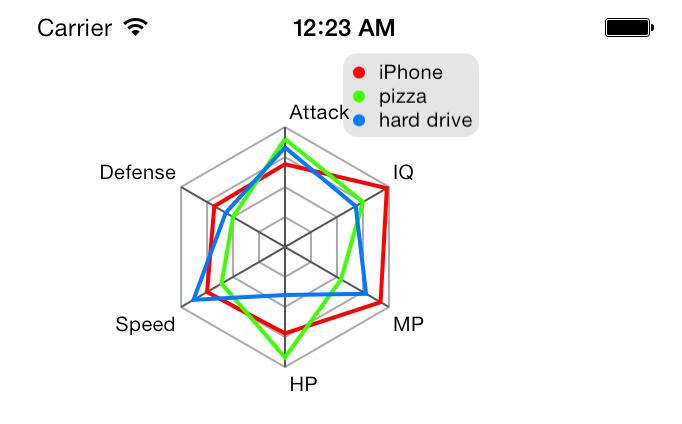
JYRadarChart
an open source iOS Radar Chart implementation.
Requirements
- Xcode 5 or higher
- iOS 5.0 or higher
- ARC
- CoreGraphics.framework
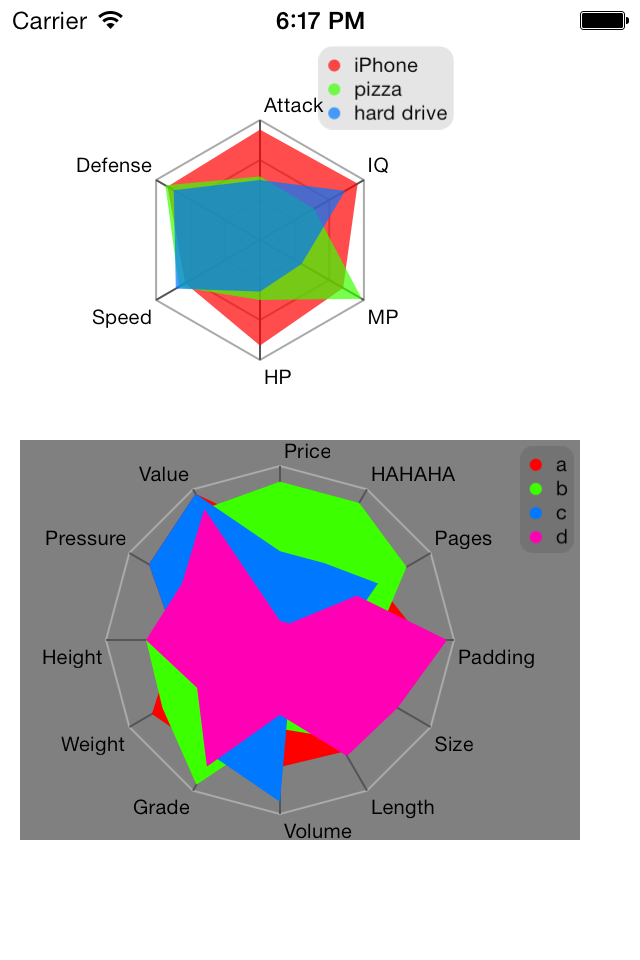
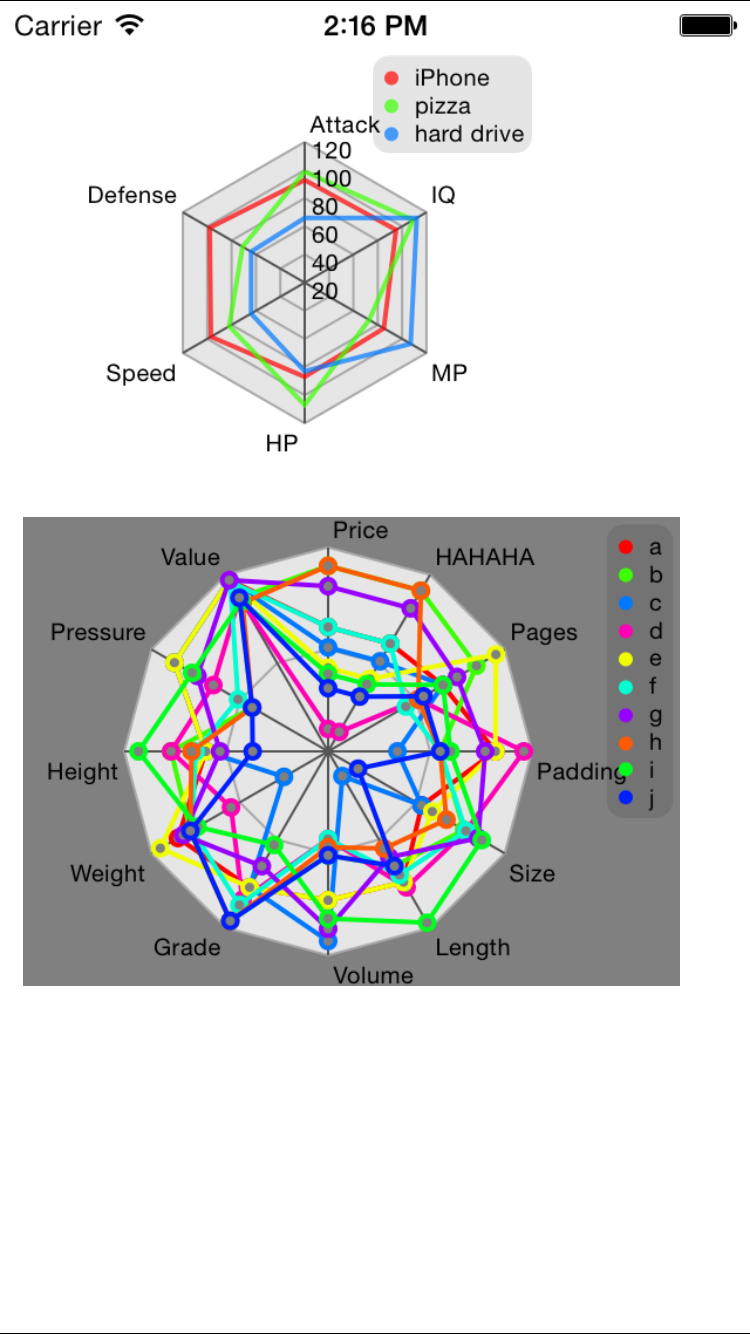
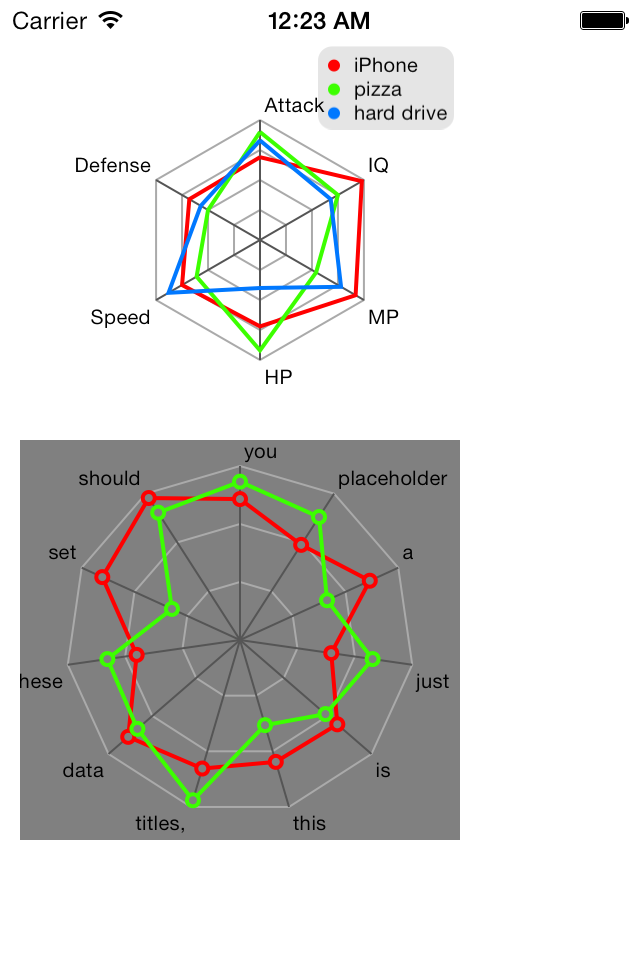
Demo
Build and run the JYRadarChartDemo project in Xcode
Installation
CocoaPods

- Create a Podfile in your project folder if you don't have one
- Add a pod entry for JYRadarChart to your Podfile
pod 'JYRadarChart' - Install the pod(s) by running
pod install - Include JYRadarChart wherever you need it with
#import "JYRadarChart.h"
Manual Install
All you need to do is drop JYRadarChart files into your project, and add #import "JYRadarChart.h" to the top of classes that will use it.
Example Usage
minimum
JYRadarChart *p = [[JYRadarChart alloc] initWithFrame:CGRectMake(30, 20, 200, 200)];
p.dataSeries = @[@[@(51),@(44),@(94),@(84),@(90)]];
p.attributes = @[@"attack",@"defense",@"speed",@"HP",@"MP"];
[self.view addSubview:p];
fully customized
JYRadarChart *p = [[JYRadarChart alloc] initWithFrame:CGRectMake(20, 20, 200, 200)];

NSArray *a1 = @[@(81), @(97), @(87), @(60), @(65), @(77)];
NSArray *a2 = @[@(91), @(87), @(33), @(77), @(78), @(96)];

//set the data series
p.dataSeries = @[a1, a2];

//how many "circles" in the chart
p.steps = 4;

//for the the entire background
p.backgroundColor = [UIColor whiteColor];

//you can specify the background fill color
//(just for the chart, not the entire background of the view)
p.backgroundFillColor = [UIColor grayColor];

//you can set radius, min and max value by yourself, but if you
//leave r (will fill the rect), minValue (will be 0), maxValue (default is 100) alone,
//that is okay. the points with too big value will be out of the chart and thus invisible
p.r = 60;
p.minValue = 20;
p.maxValue = 120;

//you can choose whether fill area or not (just draw lines)
p.fillArea = YES;

//you can specify the opacity, default is 1.0 (opaque)
p.colorOpacity = 0.7;
p.attributes = @[@"Attack", @"Defense", @"Speed", @"HP", @"MP", @"IQ"];

//if you do not need a legend, you can safely get rid of setTitles:
p.showLegend = YES;
[p setTitles:@[@"archer", @"footman"]];

//there is a color generator in the code, it will generate colors for you
//so if you do not want to specify the colors yourself, just delete the line below
[p setColors:@[[UIColor grayColor],[UIColor blackColor]]];
[self.view addSubview:p];
Customization
here are all the properties you can change, you can find them in JYRadarChart.h
@property (nonatomic, assign) CGFloat r;
@property (nonatomic, assign) CGFloat maxValue;
@property (nonatomic, assign) CGFloat minValue;
@property (nonatomic, assign) BOOL drawPoints;
@property (nonatomic, assign) BOOL fillArea;
@property (nonatomic, assign) BOOL showLegend;
@property (nonatomic, assign) BOOL showStepText;
@property (nonatomic, assign) CGFloat colorOpacity;
@property (nonatomic, strong) UIColor *backgroundLineColorRadial;
@property (nonatomic, strong) UIColor *backgroundFillColor;
@property (nonatomic, strong) NSArray *dataSeries;
@property (nonatomic, strong) NSArray *attributes;
@property (nonatomic, assign) NSUInteger steps;
@property (nonatomic, assign) CGPoint centerPoint;

- (void)setTitles:(NSArray *)titles;
- (void)setColors:(NSArray *)colors;
