XYChart
XYChart is designed for line & bar of charts which can compare mutiple datas in form styles, and limited the range of values to show, and so on.
| LineChart | BarChart |
|---|---|
 |
 |
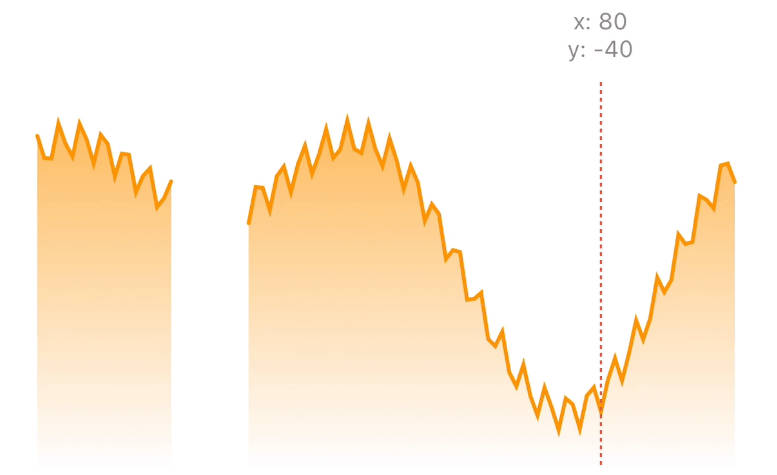
| single datas in linechart | single datas in linechart |
 |
 |
| LineDotsClicked: show all if the dots closed in multi-datas | BarClicked: custom click effects in multi-datas |
 |
 |
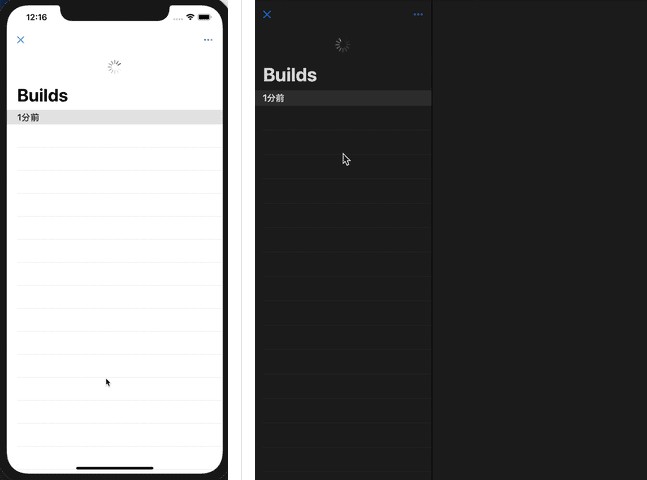
| scrolling linechart (did set row width) | scrolling barchart (did set row width) |
Install
required
iOS >= 8.0with Cocoapodspod 'XYChart'
Using
Expand for XYChart details
@interface XYChart : UIView<XYChartReload>

@property (nonatomic, weak, nullable) id<XYChartDataSource> dataSource;
@property (nonatomic, weak, nullable) id<XYChartDelegate> delegate;

@property (nonatomic, readonly) XYChartType chartType;

- (instancetype)initWithFrame:(CGRect)frame type:(XYChartType)type NS_DESIGNATED_INITIALIZER;
- (instancetype)initWithType:(XYChartType)type;

/**
 更新图标数据

 @param dataSource 数据
 @param animation 是否执行动画
 */
- (void)setDataSource:(id<XYChartDataSource>)dataSource animation:(BOOL)animation;

/**
 重载数据

 @param animation 是否执行动画
 */
- (void)reloadData:(BOOL)animation;

@end
Method 1:
_chartView = [[XYChart alloc] initWithFrame:CGRectMake(0, 0, 300, 100) chartType:XYChartTypeLine];
_chartView.dataSource = self;
_chartView.delegate = self;
[self.view addSubview:_chartView];
Method 2:
// the obj follow the XYChartDataSource protocol
_datasource = [[XYChartDataSourceItem alloc] init];

_chartView = [[XYChart alloc] initWithType:XYChartTypeLine];
_chartView.dataSource = _datasource;
[self.view addSubview:_chartView];
Expand for
@protocol XYChartDelegate
@optional

/**
 是否展示UIMenuController
 */
- (BOOL)chart:(XYChart *)chart shouldShowMenu:(NSIndexPath *)index;

/**
 点击后的action,重载一般就不show UIMenuController了
 */
- (void)chart:(XYChart *)chart itemDidClick:(id<XYChartItem>)item;

/**
 line用于展示圆圈,bar用于柱形图的动画
 */
- (CAAnimation *)chart:(XYChart *)chart clickAnimationOfIndex:(NSIndexPath *)index;

@end
Expand for XYChartDataSource protocol details
/**
 多套对比数据展示
 */
@protocol XYChartDataSource

/**
 多少条并行对比数据,折线图表现多条线,柱状图表现一列中有几条柱状图
 */
- (NSUInteger)numberOfSectionsInChart:(XYChart *)chart;

/**
 完整的周期内,数据的个数,横向列数
 */
- (NSUInteger)numberOfRowsInChart:(XYChart *)chart;

/**
 x坐标的标题
 */
- (NSAttributedString *)chart:(XYChart *)chart titleOfRowAtIndex:(NSUInteger)index;

/**
 x坐标的标题
 */
- (NSAttributedString *)chart:(XYChart *)chart titleOfSectionAtValue:(CGFloat)sectionValue;

/**
 index下的数据模型
 */
- (id<XYChartItem>)chart:(XYChart *)chart itemOfIndex:(NSIndexPath *)index;

/**
 标记y轴方向高亮区间
 */
- (XYRange)visibleRangeInChart:(XYChart *)chart;

/**
 y轴方向分段,5就分5段
 */
- (NSUInteger)numberOfLevelInChart:(XYChart *)chart;

/**
 横向一栏的宽度
 */
- (CGFloat)rowWidthOfChart:(XYChart *)chart;

/**
 自适应平均分横向栏目的宽度
 */
- (BOOL)autoSizingRowInChart:(XYChart *)chart;

@end
Author
XcodeYang, [email protected]
