SwiftUICharts
A charts / plotting library for SwiftUI. Works on macOS, iOS, watchOS, and tvOS.
Examples
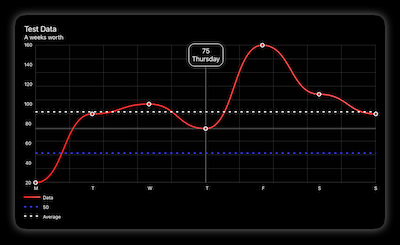
Line Chart

View
LineChart()
    .touchOverlay()
    .pointMarkers()
    .averageLine(strokeStyle: StrokeStyle(lineWidth: 3, dash: [5,10]))
    .yAxisPOI(markerName: "50", markerValue: 50, lineColour: Color(red: 0.25, green: 0.25, blue: 1.0), strokeStyle: StrokeStyle(lineWidth: 3, dash: [5,10]))
    .xAxisGrid()
    .yAxisGrid()
    .xAxisLabels()
    .yAxisLabels()
    .headerBox()
    .legends()
    .environmentObject(data)
Data Model
static func weekOfData() -> ChartData {

    let data : [ChartDataPoint] = [
        ChartDataPoint(value: 20,  xAxisLabel: "M", pointLabel: "Monday"),
        ChartDataPoint(value: 90,  xAxisLabel: "T", pointLabel: "Tuesday"),
        ChartDataPoint(value: 100, xAxisLabel: "W", pointLabel: "Wednesday"),
        ChartDataPoint(value: 75,  xAxisLabel: "T", pointLabel: "Thursday"),
        ChartDataPoint(value: 160, xAxisLabel: "F", pointLabel: "Friday"),
        ChartDataPoint(value: 110, xAxisLabel: "S", pointLabel: "Saturday"),
        ChartDataPoint(value: 90,  xAxisLabel: "S", pointLabel: "Sunday")
    ]

    let metadata   : ChartMetadata  = ChartMetadata(title       : "Test Data",
                                                    subtitle    : "A weeks worth",
                                                    lineLegend  : "Data")

    let labels      : [String]      = ["Mon", "Thu", "Sun"]

    let gridStyle   : GridStyle     = GridStyle(lineColour  : Color(.lightGray).opacity(0.25),
                                                lineWidth   : 1,
                                                dash: [CGFloat]())

    let chartStyle  : ChartStyle    = ChartStyle(infoBoxPlacement: .header,
                                                 yAxisGridStyle: GridStyle(lineColour: Color.primary.opacity(0.5)))

    let lineStyle   : LineStyle     = LineStyle(colours     : [Color(red: 1.0, green: 0.15, blue: 0.15), Color(red: 1.0, green: 0.35, blue: 0.35)],
                                                startPoint  : .leading,
                                                endPoint    : .trailing,
                                                lineType    : .curvedLine,
                                                strokeStyle : StrokeStyle(lineWidth: 3,
                                                                          lineCap: .round,
                                                                          lineJoin: .round))

    let pointStyle : PointStyle     = PointStyle(pointSize: 9, borderColour: Color.primary, lineWidth: 2, pointType: .outline, pointShape: .circle)

    return ChartData(dataPoints     : data,
                     metadata       : metadata,
                     xAxisLabels    : labels,
                     chartStyle     : chartStyle,
                     lineStyle      : lineStyle,
                     pointStyle     : pointStyle
    )
}
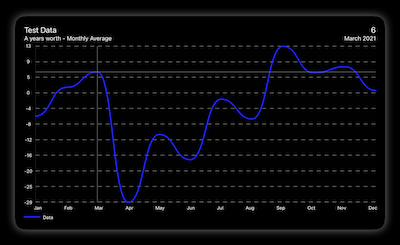
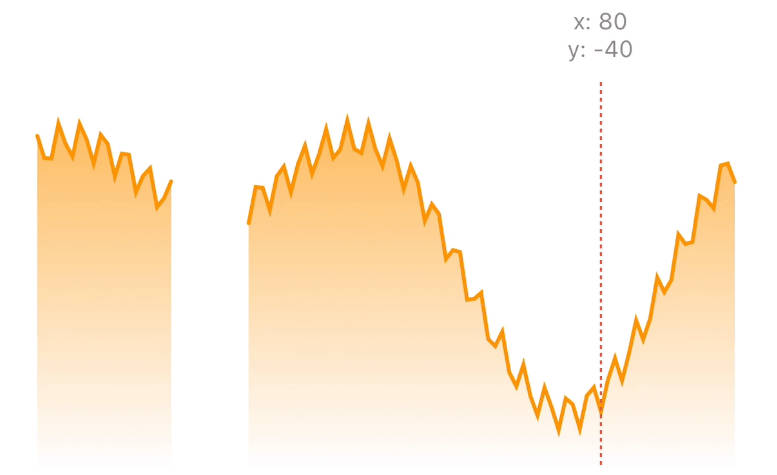
View
LineChart()
    .touchOverlay(specifier: "%.2f")
    .yAxisGrid()
    .xAxisLabels()
    .yAxisLabels()
    .headerBox()
    .legends()
    .environmentObject(data)
Data Model
static func yearOfDataMonthlyAverage() -> ChartData {

    var data : [ChartDataPoint] = []
    let calendar = Calendar.current
    let date = Date()

    for index in 1...365 {
        let value: Double = Double(Int.random(in: -100...100))
        let date = calendar.date(byAdding: .day, value: index, to: date)
        data.append(ChartDataPoint(value: value, date: date))
    }

    let metadata   : ChartMetadata  = ChartMetadata(title       : "Test Data",
                                                    subtitle    : "A years worth - Monthly Average",
                                                    lineLegend  : "Data")

    let labels      : [String]      = ["Jan", "Feb", "Mar", "Apr", "May", "Jun", "Jul", "Aug", "Sep", "Oct", "Nov", "Dec"]

    let chartStyle  : ChartStyle    = ChartStyle(infoBoxPlacement: .header,
                                                 yAxisGridStyle: GridStyle(lineColour: Color.primary.opacity(0.5)))

    let lineStyle   : LineStyle     = LineStyle(colour: Color(red: 0.15, green: 0.15, blue: 1.0),
                                                lineType: .curvedLine,
                                                strokeStyle: StrokeStyle(lineWidth: 3,
                                                                         lineCap: .round,
                                                                         lineJoin: .round))

    return ChartData(dataPoints     : data,
                     metadata       : metadata,
                     xAxisLabels    : labels,
                     chartStyle     : chartStyle,
                     lineStyle      : lineStyle,
                     calculations   : .averageMonth)
}
Bar Chart
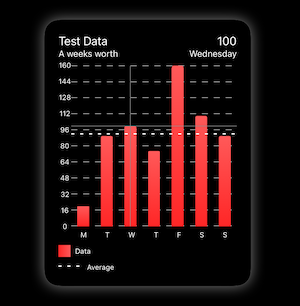
View
BarChart()
    .touchOverlay()
    .averageLine(markerName: "Average", lineColour: Color.primary, strokeStyle: StrokeStyle(lineWidth: 2, dash: [5, 10]))
    .yAxisGrid()
    .xAxisLabels()
    .yAxisLabels()
    .headerBox()
    .legends()
    .environmentObject(data)
Data Model
static func weekOfData() -> ChartData {

    let data : [ChartDataPoint] = [
        ChartDataPoint(value: 20,  xAxisLabel: "M", pointLabel: "Monday"),
        ChartDataPoint(value: 90,  xAxisLabel: "T", pointLabel: "Tuesday"),
        ChartDataPoint(value: 100, xAxisLabel: "W", pointLabel: "Wednesday"),
        ChartDataPoint(value: 75,  xAxisLabel: "T", pointLabel: "Thursday"),
        ChartDataPoint(value: 160, xAxisLabel: "F", pointLabel: "Friday"),
        ChartDataPoint(value: 110, xAxisLabel: "S", pointLabel: "Saturday"),
        ChartDataPoint(value: 90,  xAxisLabel: "S", pointLabel: "Sunday")
    ]

    let metadata   : ChartMetadata  = ChartMetadata(title       : "Test Data",
                                                    subtitle    : "A weeks worth",
                                                    lineLegend  : "Data")

    let gridStyle   : GridStyle     = GridStyle(lineColour  : Color(.lightGray),
                                                lineWidth   : 1)

    let chartStyle  : ChartStyle    = ChartStyle(infoBoxPlacement: .header,
                                                 xAxisGridStyle  : gridStyle,
                                                 yAxisGridStyle  : gridStyle)

    let barStyle    : BarStyle      = BarStyle(barWidth: 0.5,
                                               colourFrom: .barStyle,
                                               colours: [Color(red: 1.0, green: 0.15, blue: 0.15),
                                                         Color(red: 1.0, green: 0.35, blue: 0.35)],
                                               startPoint: .bottom,
                                               endPoint: .top)

    return ChartData(dataPoints     : data,
                     metadata       : metadata,
                     chartStyle     : chartStyle,
                     barStyle       : barStyle)
}
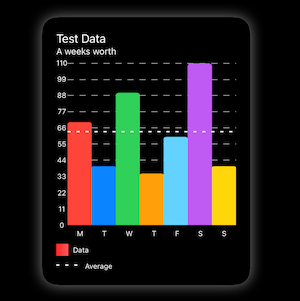
View
BarChart()
    .touchOverlay()
    .averageLine(markerName: "Average", lineColour: Color.primary, strokeStyle: StrokeStyle(lineWidth: 2, dash: [5, 10]))
    .yAxisGrid()
    .xAxisLabels()
    .yAxisLabels()
    .headerBox()
    .legends()
    .environmentObject(data)
Data Model
static func weekOfData() -> ChartData {

    let data : [ChartDataPoint] = [
        ChartDataPoint(value: 70,  xAxisLabel: "M", pointLabel: "Monday"   , colour: Color(.systemRed)),
        ChartDataPoint(value: 40,  xAxisLabel: "T", pointLabel: "Tuesday"  , colour: Color(.systemBlue)),
        ChartDataPoint(value: 90, xAxisLabel:  "W", pointLabel: "Wednesday", colour: Color(.systemGreen)),
        ChartDataPoint(value: 35,  xAxisLabel: "T", pointLabel: "Thursday" , colour: Color(.systemOrange)),
        ChartDataPoint(value: 60, xAxisLabel:  "F", pointLabel: "Friday"   , colour: Color(.systemTeal)),
        ChartDataPoint(value: 110, xAxisLabel: "S", pointLabel: "Saturday" , colour: Color(.systemPurple)),
        ChartDataPoint(value: 40,  xAxisLabel: "S", pointLabel: "Sunday"   , colour: Color(.systemYellow))
    ]

    let metadata   : ChartMetadata  = ChartMetadata(title       : "Test Data",
                                                    subtitle    : "A weeks worth",
                                                    lineLegend  : "Data")


    let gridStyle   : GridStyle     = GridStyle(lineColour  : Color(.lightGray),
                                                lineWidth   : 1)

    let chartStyle  : ChartStyle    = ChartStyle(infoBoxPlacement: .header,
                                                 xAxisGridStyle  : gridStyle,
                                                 yAxisGridStyle  : gridStyle,
                                                 xAxisLabelsFrom: .dataPoint)

    let barStyle    : BarStyle      = BarStyle(barWidth: 1,
                                               colourFrom: .dataPoints,
                                               colours: [Color(red: 1.0, green: 0.15, blue: 0.15),
                                                         Color(red: 1.0, green: 0.35, blue: 0.35)],
                                               startPoint: .bottom,
                                               endPoint: .top)

    return ChartData(dataPoints     : data,
                     metadata       : metadata,
                     chartStyle     : chartStyle,
                     barStyle       : barStyle
    )
}
Documentation
All data and most styling is passed into the view by an Environment Object. See ChartData.
.environmentObject(data)
View Modifiers
Touch Overlay
Detects input either from touch of pointer. Finds the nearest data point and displays the relevent information.
The location of the info box is set in ChartStyle.
.touchOverlay(specifier: String)
- specifier: Decimal precision for labels
Setup within ChartData --> ChartStyle
Point Markers
Lays out markers over each of the data point.
.pointMarkers()
Setup within ChartData --> PointStyle
Average Line
Shows a marker line at the average of all the data points.
.averageLine(markerName     : String        = "Average",
             lineColour     : Color         = Color.primary,
             strokeStyle    : StrokeStyle   = StrokeStyle(lineWidth: 2,
                                                          lineCap: .round,
                                                          lineJoin: .round,
                                                          miterLimit: 10,
                                                          dash: [CGFloat](),
                                                          dashPhase: 0)
- markerName: Title of marker, for the legend
- lineColour: Line Colour
- strokeStyle: Style of Stroke
Y Axis Point Of Interest
Configurable Point of interest
.yAxisPOI(markerName        : String        = "Average",
             lineColour     : Color         = Color.primary,
             strokeStyle    : StrokeStyle   = StrokeStyle(lineWidth: 2,
                                                          lineCap: .round,
                                                          lineJoin: .round,
                                                          miterLimit: 10,
                                                          dash: [CGFloat](),
                                                          dashPhase: 0)
- markerName: Title of marker, for the legend
- markerValue : Chosen point.
- lineColour: Line Colour
- strokeStyle: Style of Stroke
X Axis Grid
Adds vertical lines along the X axis.
.xAxisGrid()
Setup within ChartData --> ChartStyle --> GridStyle.
Y Axis Grid
Adds horizontal lines along the Y axis.
.yAxisGrid()
Setup within ChartData --> ChartStyle --> GridStyle.
X Axis Labels
Labels for the X axis.
.xAxisLabels()
Setup within ChartData --> ChartStyle --> XAxisLabelSetup
Y Axis Labels
Automatically generated labels for the Y axis
.yAxisLabels(specifier : String = "%.0f")
- specifier: Decimal precision specifier.
Setup within ChartData --> ChartStyle --> YAxisLabelSetup
Header Box
Displays the metadata about the chart. See ChartMetadata
.headerBox()
Legends
Legends from the data being show on the chart (See ChartMetadata ) and any markers (See Average Line and Y Axis Point Of Interest).
.legends()
Lays out markers over each of the data point.
Data Models
ChartData
The ChartData type is where the majority of the configuration is done. The only required initialiser is dataPoints.
ChartData(dataPoints    : [ChartDataPoint],
          metadata      : ChartMetadata?,
          xAxisLabels   : [String]?,
          chartStyle    : ChartStyle,
          lineStyle     : LineStyle,
          barStyle      : BarStyle,
          pointStyle    : PointStyle,
          calculations  : CalculationType)
- dataPoints: Array of ChartDataPoints. See ChartDataPoint.
- metadata: Data to fill in the metadata box above the chart. See ChartMetadata.
- xAxisLabels: Array of Strings for when there are too many data points to show all xAxisLabels.
- chartStyle : The parameters for the aesthetic of the chart. See ChartStyle.
- lineStyle: The parameters for the aesthetic of the line chart. See LineChartStyle.
- barStyle: The parameters for the aesthetic of the bar chart. See BarStyle.
- pointStyle: The parameters for the aesthetic of the data point markers. See PointStyle.
- calculations: Choose whether to perform calculations on the data points. If so, then by what means.
ChartDataPoint
ChartDataPoint holds the information for each of the individual data points.
Colours are only used in Bar Charts.
All
ChartDataPoint(value: Double,
               xAxisLabel: String?,
               pointLabel: String?,
               date: Date?
               ...)
- value: Value of the data point.
- xAxisLabel: Label that can be shown on the X axis.
- pointLabel: A longer label that can be shown on touch input.
- date: Date of the data point if any data based calculations are required.
Single Colour
ChartDataPoint(...
               colour: Color)
- colour: Colour for use with a bar chart.
Colour Gradient
ChartDataPoint(...
               colours     : [Color]?,
               startPoint  : UnitPoint?,
               endPoint    : UnitPoint?)
- colours: Colours for Gradient
- startPoint: Start point for Gradient
- endPoint: End point for Gradient
Colour Gradient with stop control
ChartDataPoint(...
               stops: [GradientStop],
               startPoint: UnitPoint?,
               endPoint: UnitPoint?)
- stops: Colours and Stops for Gradient with stop control.
- startPoint: Start point for Gradient.
- endPoint: End point for Gradient.
ChartMetadata
Data model for the chart's metadata
ChartMetadata(title: String?,
              subtitle: String?,
              lineLegend: String?)
- title: The charts Title
- subtitle: The charts subtitle
- lineLegend: The title for the legend
ChartStyle
Model for controlling the overall aesthetic of the chart.
ChartStyle(infoBoxPlacement    : InfoBoxPlacement,
           xAxisGridStyle      : GridStyle,
           yAxisGridStyle      : GridStyle,
           xAxisLabelPosition  : XAxisLabelPosistion,
           xAxisLabelsFrom     : LabelsFrom,
           yAxisLabelPosition  : YAxisLabelPosistion,
           yAxisNumberOfLabels : Int,
           globalAnimation     : Animation
- infoBoxPlacement: Placement of the information box that appears on touch input.
- xAxisGridStyle: Style of the vertical lines breaking up the chart. See GridStyle.
- yAxisGridStyle: Style of the horizontal lines breaking up the chart. See GridStyle.
- xAxisLabelPosition: Location of the X axis labels - Top or Bottom
- xAxisLabelsFrom: Where the label data come from. DataPoint or xAxisLabels
- yAxisLabelPosition: Location of the X axis labels - Leading or Trailing
- yAxisNumberOfLabel: Number Of Labels on Y Axis
- globalAnimation: Gobal control of animations.
GridStyle
Model for controlling the look of the Grid
GridStyle(numberOfLines : Int,
          lineColour    : Color,
          lineWidth     : CGFloat,
          dash          : [CGFloat],
          dashPhase     : CGFloat)
- numberOfLines: Number of lines to break up the axis
- lineColour: Line Colour
- lineWidth: Line Width
- dash: Dash
- dashPhase: Dash Phase
XAxisLabelSetup
Model for the styling of the labels on the X axis.
XAxisLabelSetup(labelPosition: XAxisLabelPosistion,
                labelsFrom: LabelsFrom)
- labelPosition: Location of the X axis labels - Top or Bottom
- labelsFrom: Where the label data come from. DataPoint or xAxisLabels
YAxisLabelSetup
Model for the styling of the labels on the Y axis.
YAxisLabelSetup(labelPosition   : YAxisLabelPosistion,
                numberOfLabels  : Int)
- labelPosition: Location of the Y axis labels - Leading or Trailing
- numberOfLabels: Number Of Labels on Y Axis
LineStyle
Model for controlling the overall aesthetic of the line chart.
There are three possible initialisers: Single Colour, Colour Gradient or Colour Gradient with stop control.
Single Colour
LineChartStyle(colour: Color,
          ...
- colour: Single Colour
Colour Gradient
LineChartStyle(colours: [Color]?,
               startPoint: UnitPoint?,
               endPoint: UnitPoint?,
               ...
- colours: Colours for Gradient
- startPoint: Start point for Gradient
- endPoint: End point for Gradient
Colour Gradient with stop control
LineChartStyle(stops: [GradientStop],
               startPoint: UnitPoint?,
               endPoint: UnitPoint?,
               ...
- stops: Colours and Stops for Gradient with stop control.
- startPoint: Start point for Gradient.
- endPoint: End point for Gradient.
All
LineChartStyle(...
               strokeStyle : StrokeStyle,
               ignoreZero: Bool)
- lineType: Drawing style of the line.
- strokeStyle: Stroke Style
- ignoreZero: Whether the chart should skip data points who's value is 0 while keeping the spacing.
BarStyle
Model for controlling the aesthetic of the bar chart.
There are three possible initialisers: Single Colour, Colour Gradient or Colour Gradient with stop control.
All
BarStyle(barWidth       : CGFloat,
         cornerRadius   : CornerRadius,
         colourFrom     : ColourFrom,
         ...)
- barWidth: How much of the available width to use. 0...1
- cornerRadius: Corner radius of the bar shape.
- colourFrom: Where to get the colour data from.
Single Colour
BarStyle(...
         colour: Single Colour)
- colour: Single Colour
Colour Gradient
BarStyle(...
         colours     : [Color]
         startPoint  : UnitPoint
         endPoint    : UnitPoint)
- colours: Colours for Gradient
- startPoint: Start point for Gradient
- endPoint: End point for Gradient
Colour Gradient with stop control
BarStyle(...
         stops       : [GradientStop]
         startPoint  : UnitPoint
         endPoint    : UnitPoint)
- stops: Colours and Stops for Gradient with stop control.
- startPoint: Start point for Gradient.
- endPoint: End point for Gradient.
PointStyle
Model for controlling the aesthetic of the point markers.
PointStyle(pointSize    : CGFloat,
           borderColour : Color,
           fillColour   : Color,
           lineWidth    : CGFloat,
           pointType    : PointType,
           pointShape   : PointShape)
- pointSize: Overall size of the mark
- borderColour: Outter ring colour
- fillColour: Center fill colour
- lineWidth: Outter ring line width
- pointType: Style of the point marks.
- pointShape: Shape of the points