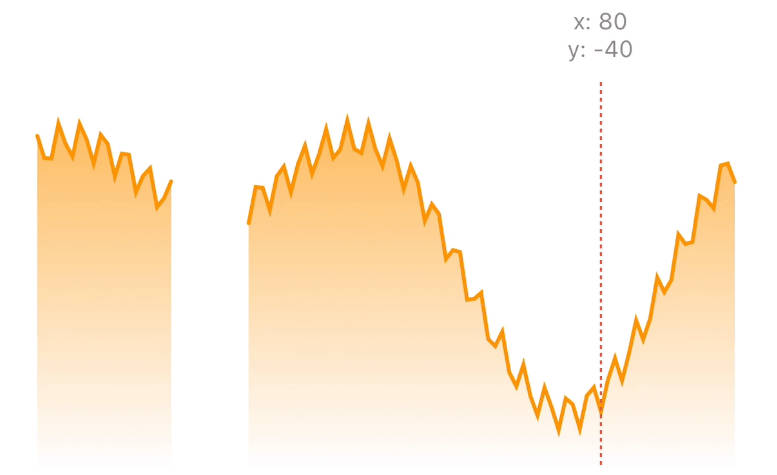
Mobile Analytics Chart
A Mobile Analytics Chart With Swift.
Animation redrawing
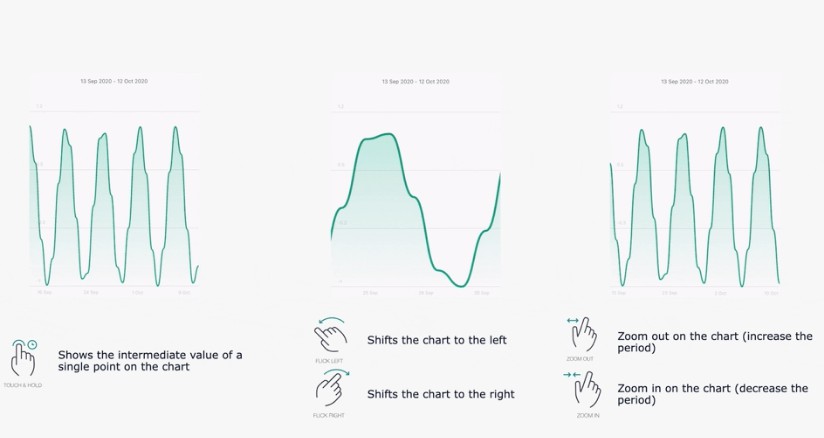
Gestures
Loading state
An intermediate value
Supported
- Multiple chart
- Dragging and panning
- Single point display
- Animation redrawing
- Customization
- Dark Theme
Chart configuration
- Quantity and currency units
- Linear, quadratic and horizontalQuadratic path type
- Gradient
Render configuration
- Customize range label, XAxis, YAxis, zero line, definition view
- Toggle gesture (Swipe, pinch and handle)
- Setup redraw animation duration
- Configure insets and margins
Calculator configuration
- Setup minimum and maximum like custom value or these values will be recalculated automatically
- Customize automatically recalculated line width
Connecting dependencies
Swift Package Manager
dependencies: [
  .package(url: "https://github.com/yoomoney-tech/mobile-analytics-chart-swift")
],
targets: [
  .target(
    name: "MyProject",
    dependencies: [..., "MobileAnalyticsChartSwift"]
  )
...
]
CocoaPods
- Install CocoaPods
gem install cocoapods
- Create file Podfile\
CocoaPods provides
pod initcommand to create a Podfile with default settings.
- Add dependencie in
Podfile.
ExamplePodfilefrom demo-app.
source 'https://github.com/CocoaPods/Specs.git'
platform :ios, '11.0'
use_frameworks!

target 'Your Target Name' do
pod 'MobileAnalyticsChartSwift',
  :git => 'https://github.com/yoomoney-tech/mobile-analytics-chart-swift.git',
  :tag => 'tag'
end
Your Target Name- the target name in Xcode for your application.
tag- SDK version. The current version can be found on github in the releases.
- Run the command
pod install
Carthage
Carthage is not currently supported.
Fast integration
- Create
AnalyticsChartSpriteKitModuleInputData.
To work with MobileAnalyticsChartSwift entities, import the dependencies into the source file
import MobileAnalyticsChartSwift
An example of creating a AnalyticsChartSpriteKitModuleInputData:
// Creating a fade animation configuration
let fadeAnimation = ChartFadeAnimation(
  fadeOutColor: UIColor(white: 219 / 255, alpha: 1),
  fadeInColor: UIColor(white: 236 / 255, alpha: 1),
  startDuration: 0.2,
  fadeOutDuration: 0.6,
  fadeInDuration: 0.6
)

// Creating date formatters
let dmmmyyyyDateFormatter = DateFormatter()
dmmmyyyyDateFormatter.dateFormat = "d MMM yyyy"
let dmmmDateFormatter = DateFormatter()
dmmmDateFormatter.dateFormat = "d MMM"

// Creating a chart data
let calendar = Calendar.current
let dates = (0 ..< 6).compactMap {
  calendar.date(byAdding: DateComponents(day: $0), to: Date())
}
let values: [CGFloat] = [4, 8, 15, 16, 23, 42]
let chartData = ChartData(
  values: values,
  dates: dates
)
let path = ChartPath(
  type: .horizontalQuadratic,
  color: UIColor(red: 51 / 255, green: 102 / 255, blue: 1, alpha: 1),
  minWidth: 1.0,
  maxWidth: 5.0,
  fadeAnimation: fadeAnimation
)
let chartRenderConfiguration = ChartRenderConfiguration(
  unit: .quantity,
  path: path,
  gradient: nil
)
let analyticsChartSpriteKitViewModel = AnalyticsChartSpriteKitViewModel(
  data: chartData,
  configuration: chartRenderConfiguration
)

// Creating a range label configuration
let rangeLabel = ChartRangeLabel(
  color: UIColor(white: 102 / 255, alpha: 1),
  font: .systemFont(ofSize: 13, weight: .regular),
  dateFormatter: dmmmyyyyDateFormatter,
  insets: UIEdgeInsets(top: 16, left: 0, bottom: 16, right: 0)
)

// Creating a xAxis configuration
let xAxis = ChartXAxis(
  labelColor: UIColor(white: 179 / 255, alpha: 1),
  labelFont: .systemFont(ofSize: 11, weight: .regular),
  dateFormatter: dmmmDateFormatter,
  insets: UIEdgeInsets(top: 8, left: 0, bottom: 0, right: 0),
  margins: UIEdgeInsets(top: 0, left: 16, bottom: 0, right: 16),
  zoomFactorLabels: 1.5
)

// Creating a yAxis configuration
let yAxis = ChartYAxis(
  labelColor: UIColor(white: 179 / 255, alpha: 1),
  labelFont: .systemFont(ofSize: 11, weight: .regular),
  labelInsets: UIEdgeInsets(top: 8, left: 16, bottom: 8, right: 0),
  lineColor: UIColor(white: 0, alpha: 0.12),
  lineWidth: 1
)

// Creating a zero line
let zeroLine = ChartZeroLine(
    color: UIColor(white: 236 / 255, alpha: 1),
    width: 1
)

// Creating a gesture state configuration
let gestureState = ChartGestureState(
  swipeIsActive: true,
  pinchIsActive: true,
  handleIsActive: true
)

// Creating a animation configuration
let animation = ChartAnimation(
  redrawDuration: 0.2
)

// Creating a definition configuration
let definitionView = ChartDefinitionView(
  backgroundColor: UIColor(red: 0.043, green: 0.09, blue: 0.204, alpha: 1),
  valueLabelFont: .systemFont(ofSize: 13),
  valueLabelColor: UIColor(white: 0.95, alpha: 1.0),
  dateLabelFont: .systemFont(ofSize: 11),
  dateLabelColor: UIColor(white: 0.7, alpha: 1.0),
  dateFormatter: dmmmyyyyDateFormatter
)
let definition = ChartDefinition(
  line: ChartDefinitionLine(color: UIColor(white: 236 / 255, alpha: 1), width: 1),
  point: ChartDefinitionPoint(minRadius: 4, maxRadius: 8),
  view: definitionView,
  fadeAnimation: fadeAnimation
)

// Creating a chart sprite kit module input data
let chartViewModel = AnalyticsChartSpriteKitModuleInputData(
  viewModels: [analyticsChartSpriteKitViewModel],
  renderConfiguration: RenderConfiguration(
    rangeLabel: rangeLabel,
    xAxis: xAxis,
    yAxis: yAxis,
    zeroLine: zeroLine,
    gestureState: gestureState,
    animation: animation,
    definition: definition,
    backgroundColor: UIColor(white: 247 / 255, alpha: 1),
    chartInsets: .zero,
    chartMargins: UIEdgeInsets(top: 64, left: 0, bottom: 0, right: 0),
    fadeInDuration: 0.3,
    fadeOutDuration: 0.3
  ),
  calculatorConfiguration: CalculatorConfiguration(
    minStaticValue: nil,
    maxStaticValue: nil
  )
)
- Create
ChartViewandAnalyticsChartSpriteKitModuleInputusingAnalyticsChartSpriteKitAssembly.
An example of creating:
let (chartView, moduleInput) = AnalyticsChartSpriteKitAssembly.makeModule(
  inputData: chartViewModel
)
- ChartView is a UIView and you can use it wherever you want.
- With AnalyticsChartSpriteKitModuleInput you can set charts, set visibility range and enable or disable charts loading state.
Run Example
To run the Example application, you need to:
- Make a
git cloneof the repository.
git clone https://github.com/yoomoney-tech/mobile-analytics-chart-swift.git
- Go to the project folder in the console and execute the following commands:
gem install bundler
bundle
pod install
- Open
MobileAnalyticsChartSwift.xcworkspace. - Select and run a scheme
MobileAnalyticsChartSwiftExamplePods.
GitHub
https://github.com/yoomoney-tech/mobile-analytics-chart-swift