macos-telegraf-gpumonitoring
Sharing a tool to get GPU information from Intel and Apple silicon based macs. This command line tool is used with telegraf to populate an Influxdb bucket to display stats in grafana;
You like it? You use it? It saved you a couple of hours? Hey ??? You can now buy me a coffee! ☕️
Disclaimer, this code has been tested on:
- Intel Mac Pro with AMD Radeon Pro W6600
- Apple Silicon Macbook M1 Ultra
It hasn’t been tested on multi-gpu setup but should be quite easily adapted.
Installation process
- Copy gpuPerformanceStatistics to /usr/local/bin
- Update your telegraf.conf accordingly (see example bellow)
- Restart telegraf
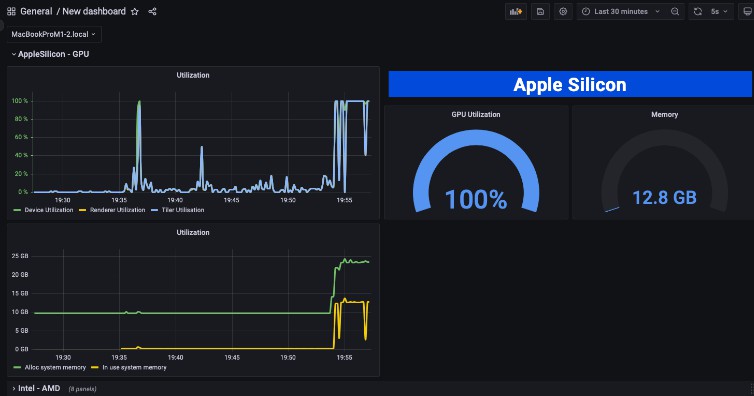
- Update and use provided grafana dashboard json as template
- Enjoy
GPU performance statistics are exported using Apple IOKitframework as a JSON.
Telegraf is configured to invoke gpuPerformanceStatistics and parse the JSON output to ingest all available fields and send them to influxdb.
Here’s an example of telegraf.conf
[[inputs.execd]]
  command = ["/usr/local/bin/gpuPerformanceStatistics", "IOAccelerator"]
  name_override = "macosgpu"
  signal = "none"
  restart_delay = "10s"
  data_format="json"

[[outputs.influxdb_v2]]
  urls = ["http://yourinfluxdbserver:8086"]
  ## Token for authentication.
  token = "yourtoken"

  ## Organization is the name of the organization you wish to write to; must exist.
  organization = "yourorganisation""

  ## Destination bucket to write into.
  ## Change it and update the dashboard accordingly (hint: find/replace into the grafana dashboard json BEFORE importing it into grafana, you'll save time)
  bucket = "XRRMonitoring"
gpuPerformanceStatistics usage
> gpuPerformanceStatistics --help

Usage: gpuPerformanceStatistics className
On Intel and Apple silicon macs you can use the classname IOAccelerator to be safe or you can be more specific with something like AMDRadeonX6000_AMDNavi23GraphicsAccelerator (if you have multiple GPUs. ioreg -l is your friend to find your targets…)
Main AMD GPU metrics (and more)
- Core Clock (MHz)
- Memory Clock (MHz)
- Total Power (W)
- Device Utilization (%)
- Temperature (C)
- Fan Speed (%)
- Fan Speed (RPM)
- GPU Activity (%)
Apple Silicon metrics (that’s all)
- Device Utilization
- Renderer Utilization
- Tiler Utilization
- Alloc system memory
- In use system memory


You like it? You use it? It saved you a couple of hours? Hey ??? You can now buy me a coffee! ☕️