JTChartView
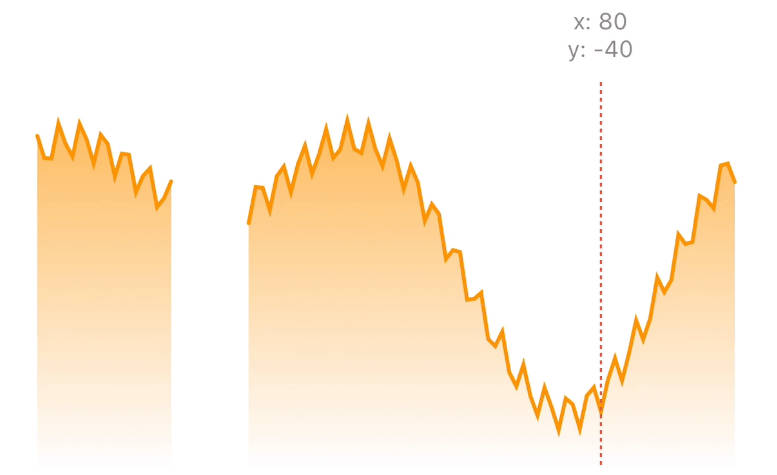
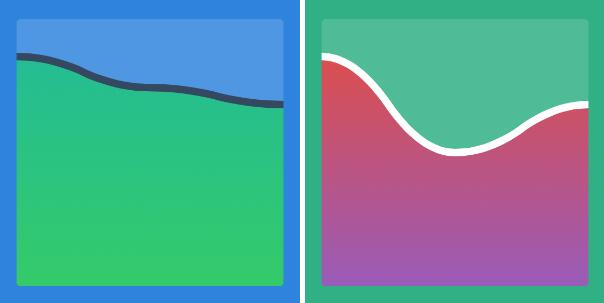
JTChartView is the new lightweight and fully customizable solution to draw a curve and fill the space underneath it with a gradient. The result is a beautiful chart.
Installation
There are two ways to add the JTProgressHUD library to your project. Add it as a regular library or install it through CocoaPods.
pod 'JTChartView'
You may also quick try the example project with
pod try JTChartView
Library requires target iOS 7.0 and above
Works in both - Portrait and Landscape modes
Usage and Customization
JTChartView is designed to be created in one initialization line of code. Core logic creates all layers and draws them into final JTChartView. You MUST create a parent view for that JTChartView to keep it working correctly.
Simple example:
// Parent view (Whatever you need)
UIView *baseChartView = [[UIView alloc] initWithFrame:CGRectMake(30.0, 30.0, self.view.frame.size.width - 60.0, self.view.frame.size.width - 60.0)];
baseChartView.layer.masksToBounds = true;
baseChartView.backgroundColor = [UIColor whiteColor];

// JTChartView
JTChartView *chartView = [[JTChartView alloc] initWithFrame:baseChartView.bounds
                                              values:@[@15, @5, @10]
                                              curveColor:[UIColor grayColor]
                                              curveWidth:5.0
                                              topGradientColor:[UIColor redColor]
                                              bottomGradientColor:[UIColor orangeColor]
                                              minY:0.5
                                              maxY:1.0
                                              topPadding:10.0];
[baseChartView addSubview:chartView];