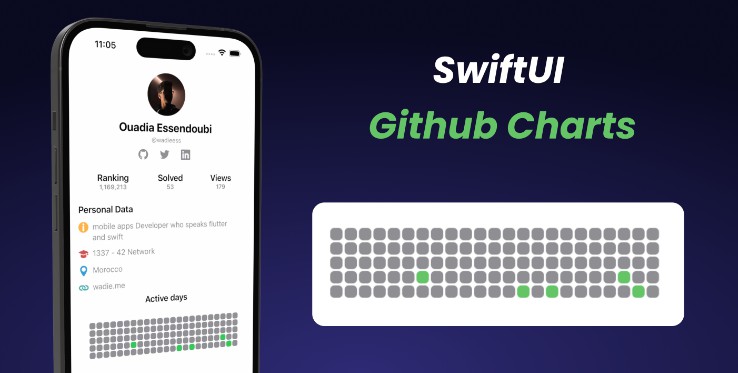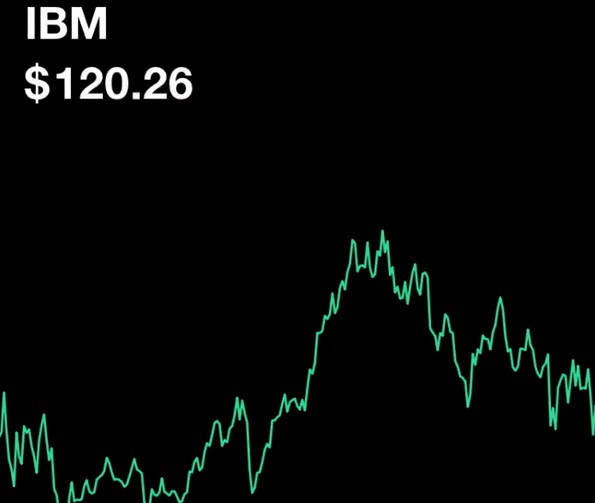
RHLinePlot
Line plot like in Robinhood app, in SwiftUI
Looking for how to do the moving price label effect? Another repo here.
P.S. Of course this is not, in anyway, affiliated with Robinhood officially. This is just an attempt to replicate its UI and I don’t own any of this design.
Demo stock API is from Alphavantage.
Table of Contents
Features
✨
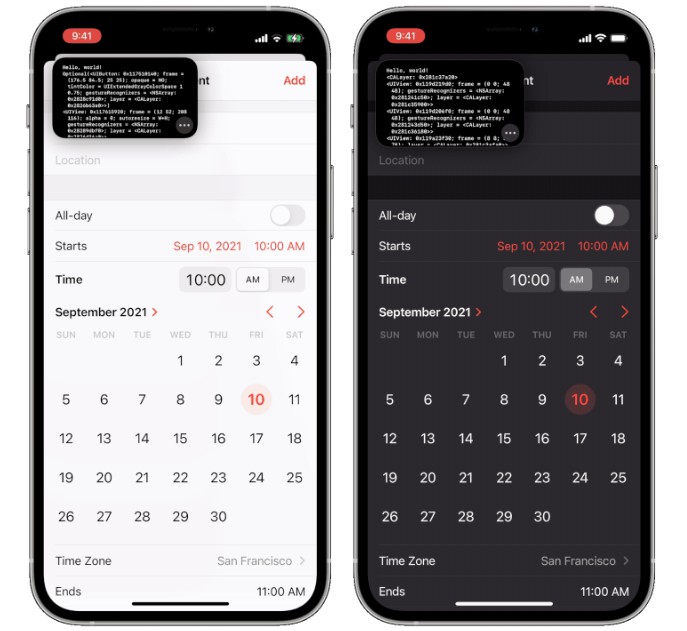
- Support drag interaction, highlight active segment
- Support glowing indicator, i.e. for real-time data
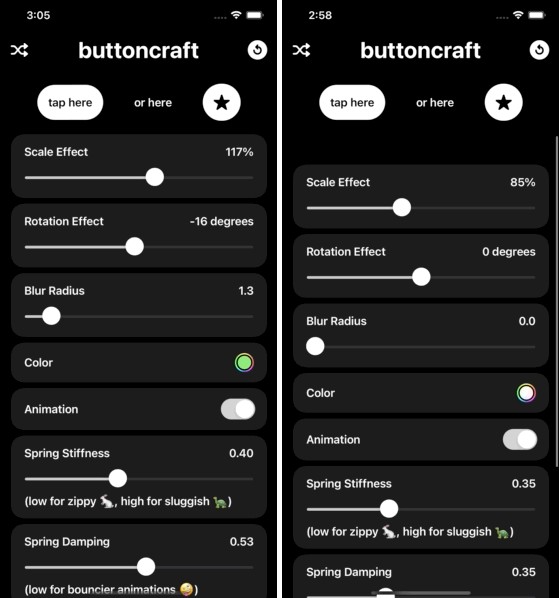
- Customize animation duration, glowing size, labels etc.
- Laser mode!
Play around with the example app to see possible customizations and the Robinhood-style view shown in the demo.
Installation
Cocoapods
pod install RHLinePlot
Or just use the source however you like. The library is in folder RHLinePlot.
APIs
Without any interaction
RHLinePlot(
    values: valuesToPlot,
    occupyingRelativeWidth: 0.8,
    showGlowingIndicator: true,
    lineSegmentStartingIndices: segments,
    activeSegment: 2,
    customLatestValueIndicator: {
      // Return a custom glowing indicator if you want
    }
)
Notes:
segmentsis the beginning indices of each segment. I.e.values = [1,2,3,4,3,2,1,2,3,4]andsegments = [0,4,8]means there are three segments in this line plot: 0-3, 4-7, 8-9.occupyingRelativeWidth = 0.8is to plot 80% of the plot canvas. This is useful to simulate realtime data. I.e. compute the current hour of the day relative to the 24-hour timeframe and use that ratio. By default this is 1.0.
With interactive elements
RHInteractiveLinePlot(
    values: values,
    occupyingRelativeWidth: 0.8,
    showGlowingIndicator: true,
    lineSegmentStartingIndices: segments,
    didSelectValueAtIndex: { index in
      // Do sth useful with index...
},
    customLatestValueIndicator: {
      // Custom indicator...
},
    valueStickLabel: { value in
      // Label above the value stick...
})
Configuration via Environment
To customize:
YourView
.environment(\.rhLinePlotConfig, RHLinePlotConfig.default.custom(f: { (c) in
    c.useLaserLightLinePlotStyle = isLaserModeOn
}))
Full config:
var new = self
f(&new)
return new
}
}
“>
public struct RHLinePlotConfig {

    /// Width of the rectangle holding the glowing indicator (i.e. not `radius`, but rather `glowingIndicatorWidth = 2*radius`). Default is `8.0`
    public var glowingIndicatorWidth: CGFloat = 8.0

    /// Line width of the line plot. Default is `1.5`
    public var plotLineWidth: CGFloat = 1.5

    /// If all values are equal, we will draw a straight line. Default is 0.5 which draws a line at the middle.
    public var relativeYForStraightLine: CGFloat = 0.5

    /// Opacity of unselected segment. Default is `0.3`.
    public var opacityOfUnselectedSegment: Double = 0.3

    /// Animation duration of opacity on select/unselect a segment. Default is `0.1`.
    public var segmentSelectionAnimationDuration: Double = 0.1

    /// Scale the fading background of glowing indicator to specified value. Default is `5` (scale to 5 times bigger before disappear)
    public var glowingIndicatorBackgroundScaleEffect: CGFloat = 5

    public var glowingIndicatorDelayBetweenGlow: Double = 0.5
    public var glowingIndicatorGlowAnimationDuration: Double = 0.8

    /// Use laser stroke mode to plot lines.
    ///
    /// Note that your plot will be automatically shrinked so that the blurry part fits inside the canvas.
    public var useLaserLightLinePlotStyle: Bool = false

    /// Use drawing group for laser light mode.
    ///
    /// This will increase responsiveness if there's a lot of segments.
    /// **But, the blurry parts will be clipped off the canvas bounds.**
//    public var useDrawingGroupForLaserLightLinePlotStyle: Bool = false

    /// The edges to fit the line strokes within canvas. This interacts with `plotLineWidth`. Default is `[]`.
    ///
    /// By default only the line skeletons (*paths*) exactly fits in the canvas,** without considering the `plotLineWidth`**.
    /// So when you increase the line width, the edge of the extreme values could go out of the canvas.
    /// You can provide a set of edges to consider to adjust to fit in canvas.
    public var adjustedEdgesToFitLineStrokeInCanvas: Edge.Set = []

    // MARK:- RHInteractiveLinePlot

    public var valueStickWidth: CGFloat = 1.2
    public var valueStickColor: Color = .gray

    /// Padding from the highest point of line plot to value stick. If `0`, the top of value stick will be at the same level of the highest point in plot.
    public var valueStickTopPadding: CGFloat = 28

    /// Padding from the lowest point of line plot to value stick. If `0`, the end of value stick will be at the same level of the lowest point in plot.
    public var valueStickBottomPadding: CGFloat = 28

    public var spaceBetweenValueStickAndStickLabel: CGFloat = 8

    /// Duration of long press before the value stick is activated and draggable.
    ///
    /// The more it is, the less likely the interactive part is activated accidentally on scroll view. Default is `0.1`.
    ///
    /// There's some lower-bound on this value that I guess coming from delaysContentTouches of
    /// the ScrollView. So if this is `0`, iit won't immediately activate the long press (but quickly horizontal pan will).
    public var minimumPressDurationToActivateInteraction: Double = 0.1

    public static let `default` = RHLinePlotConfig()

    public func custom(f: (inout RHLinePlotConfig) -> Void) -> RHLinePlotConfig {
        var new = self
        f(&new)
        return new
    }
}
TODO
- Support two finger drag to compare between two values on the plot.
Dragging in the interactive plot consumes all the gestures. If you put it in a– Fixed by using a clear proxy view to handle gesturesScrollView, you can’t scroll the scroll view in the interactive plot area, you’d be interacting with the plot instead.
Fun Solved Problems
Drag gesture consumes all the drag
Problem: So you can’t put the plot in a scroll view and scroll down on the plot. I tried adding
LongPressGesturelike in Apple’s tutorial, but looks like it too consumes gesture exclusively if put under a scroll view.
Solution: This is currently fixed by putting a proxy view that implements custom long press gesture detection.
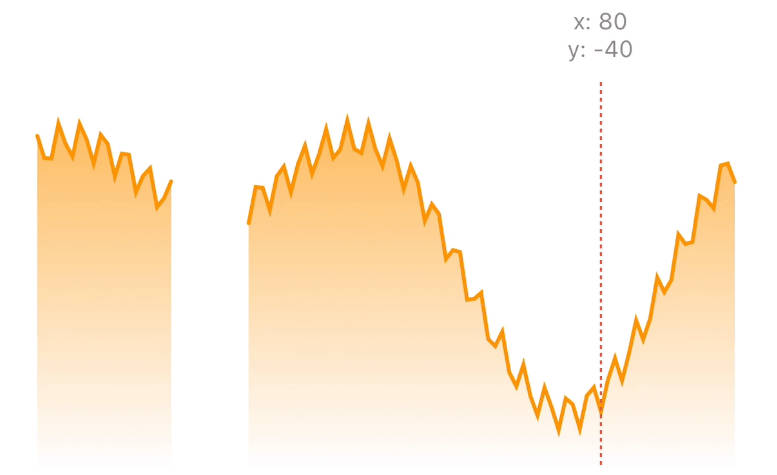
Indicator label must stick at the edge of plot
Problem: To stick the indicator label (
valueStickLabel) translation at the horizontal edge of the plot, we need to know the label width. However its content is dynamic, it could be anything a user set.
Solution: This is fixed by having two valueStickLabels. First one is used for sizing and hidden away. The second one is overlaid on the first with GeometryReader, so we know the final size of the label, ready to calculate the translation next (where we could clamp its offset with the width).
// Indicator Label
//
// HACK: Get a dynamic size of the indicator label with `overlay` + `GeometryReader`.
// Hide the bottom one (just use it for sizing), then show the overlaid one.
valueStickLabel.opacity(0)
    .overlay(
        GeometryReader { labelProxy in
            valueStickLabel
                .transformEffect(labelTranslation(labelProxy: labelProxy))
        }.opacity(stickAndLabelOpacity))
Laser mode is unresponsive to segment highlighting
Problem: The laser mode puts 3 blur effects on each segment of the line plot, so it can be unresponsive to drag around fast and animate opacity of different parts.
Solution: Just use drawingGroup(). This helps a lot. However, this introduces the next issue:
The blurry effect is clipped off at the edge of the plot frame with drawingGroup()
Problem: Using
drawingGroup()seems to apply theclipsToBounds-like effect on the blurry part, and it doesn’t look nice.
Solution: Inset the plot canvas relative to the plotLineWidth config (the larger the value, the larger the blurry blob) so that drawingGroup has more space to draw and cache image:
let adjustedEachBorderDueToBlur: CGFloat = {
    if rhLinePlotConfig.useLaserLightLinePlotStyle {
        return 7.5 * rhLinePlotConfig.plotLineWidth // Magic number accounts for blurring
    } else {
        return 0
    }
}()
let largerCanvas = canvasFrame.insetBy(dx: -adjustedEachBorderDueToBlur, dy: -adjustedEachBorderDueToBlur)