SwiftUICharts
Swift package for displaying charts effortlessly.
It supports:
- Line charts
- Bar charts
- Pie charts
Installation:
It requires iOS 13 and xCode 11!
In xCode got to File -> Swift Packages -> Add Package Dependency and paste inthe repo's url: https://github.com/AppPear/ChartView
Usage:
import the package in the file you would like to use it: import SwiftUICharts
You can display a Chart by adding a chart view to your parent view:
Demo
Added an example project, with iOS, watchOS target: https://github.com/AppPear/ChartViewDemo
Line charts
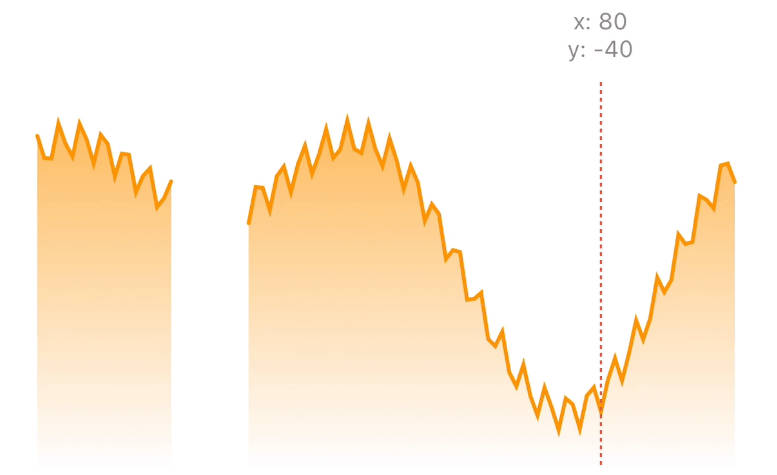
New full screen view called LineView!!!
LineView(data: [8,23,54,32,12,37,7,23,43], title: "Line chart", legend: "Full screen") // legend is optional, use optional .padding()
Adopts to dark mode automatically
Line chart is interactive, so you can drag across to reveal the data points
You can add a line chart with the following code:
LineChartView(data: [8,23,54,32,12,37,7,23,43], title: "Title", legend: "Legendary") // legend is optional
Turn drop shadow off by adding to the Initialiser: dropShadow: false
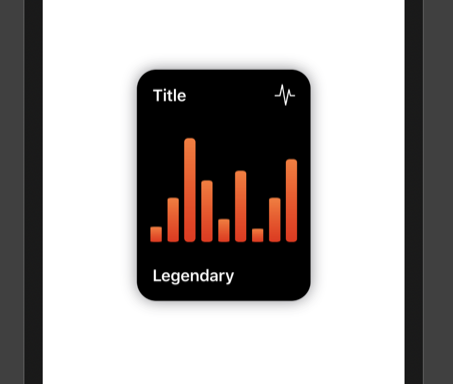
Bar charts
Bar chart is interactive, so you can drag across to reveal the data points
You can add a bar chart with the following code:
BarChartView(data: [8,23,54,32,12,37,7,23,43], title: "Title", legend: "Legendary") // legend is optional
You can add different formats:
- Small
Form.small - Medium
Form.medium - Large
Form.large
BarChartView(data: [8,23,54,32,12,37,7,23,43], title: "Title", form: Form.small)
Turn drop shadow off by adding to the Initialiser: dropShadow: false
You can customize styling of the chart with a ChartStyle object:
Customizable:
- background color
- accent color
- second gradient color
- text color
- legend text color
 let chartStyle = ChartStyle(backgroundColor: Color.black, accentColor: Colors.OrangeStart, secondGradientColor: Colors.OrangeEnd, chartFormSize: Form.medium, textColor: Color.white, legendTextColor: Color.white )
 ...
 BarChartView(data: [8,23,54,32,12,37,7,23,43], title: "Title", style: chartStyle)
You can access built-in styles:
BarChartView(data: [8,23,54,32,12,37,7,23,43], title: "Title", style: Styles.barChartMidnightGreen)
All styles available as a preset:
- barChartStyleOrangeLight
- barChartStyleOrangeDark
- barChartStyleNeonBlueLight
- barChartStyleNeonBlueDark
- barChartMidnightGreenLight
- barChartMidnightGreenDark
You can customize the size of the chart with a Form object:
Form
.small.medium.large.detail
BarChartView(data: [8,23,54,32,12,37,7,23,43], title: "Title", form: Form.small)
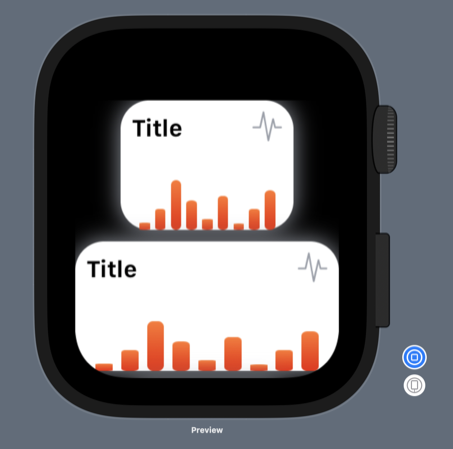
WatchOS support for Bar charts:
Pie charts
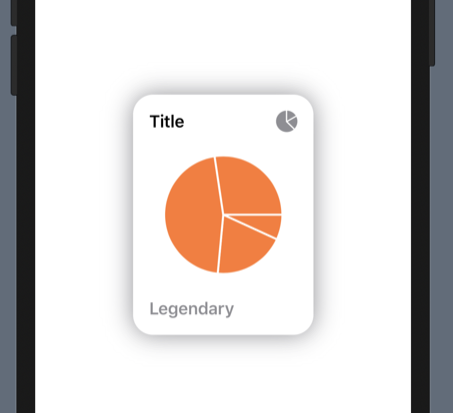
You can add a line chart with the following code:
PieChartView(data: [8,23,54,32], title: "Title", legend: "Legendary") // legend is optional
Turn drop shadow off by adding to the Initialiser: dropShadow: false