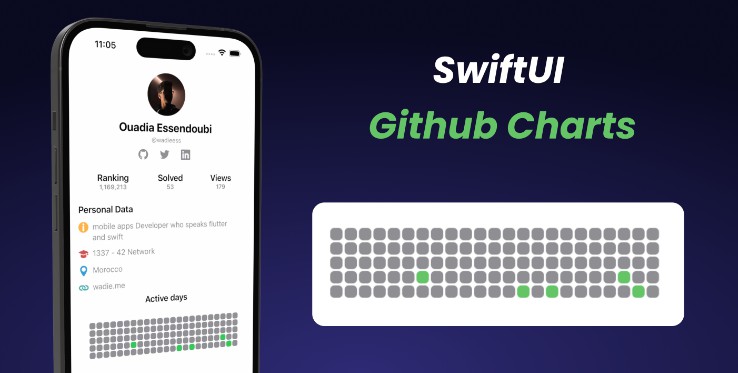
SwiftUI Charts
Build custom charts with SwiftUI.
See /Playgrounds/Charts for more examples
Styles
Line
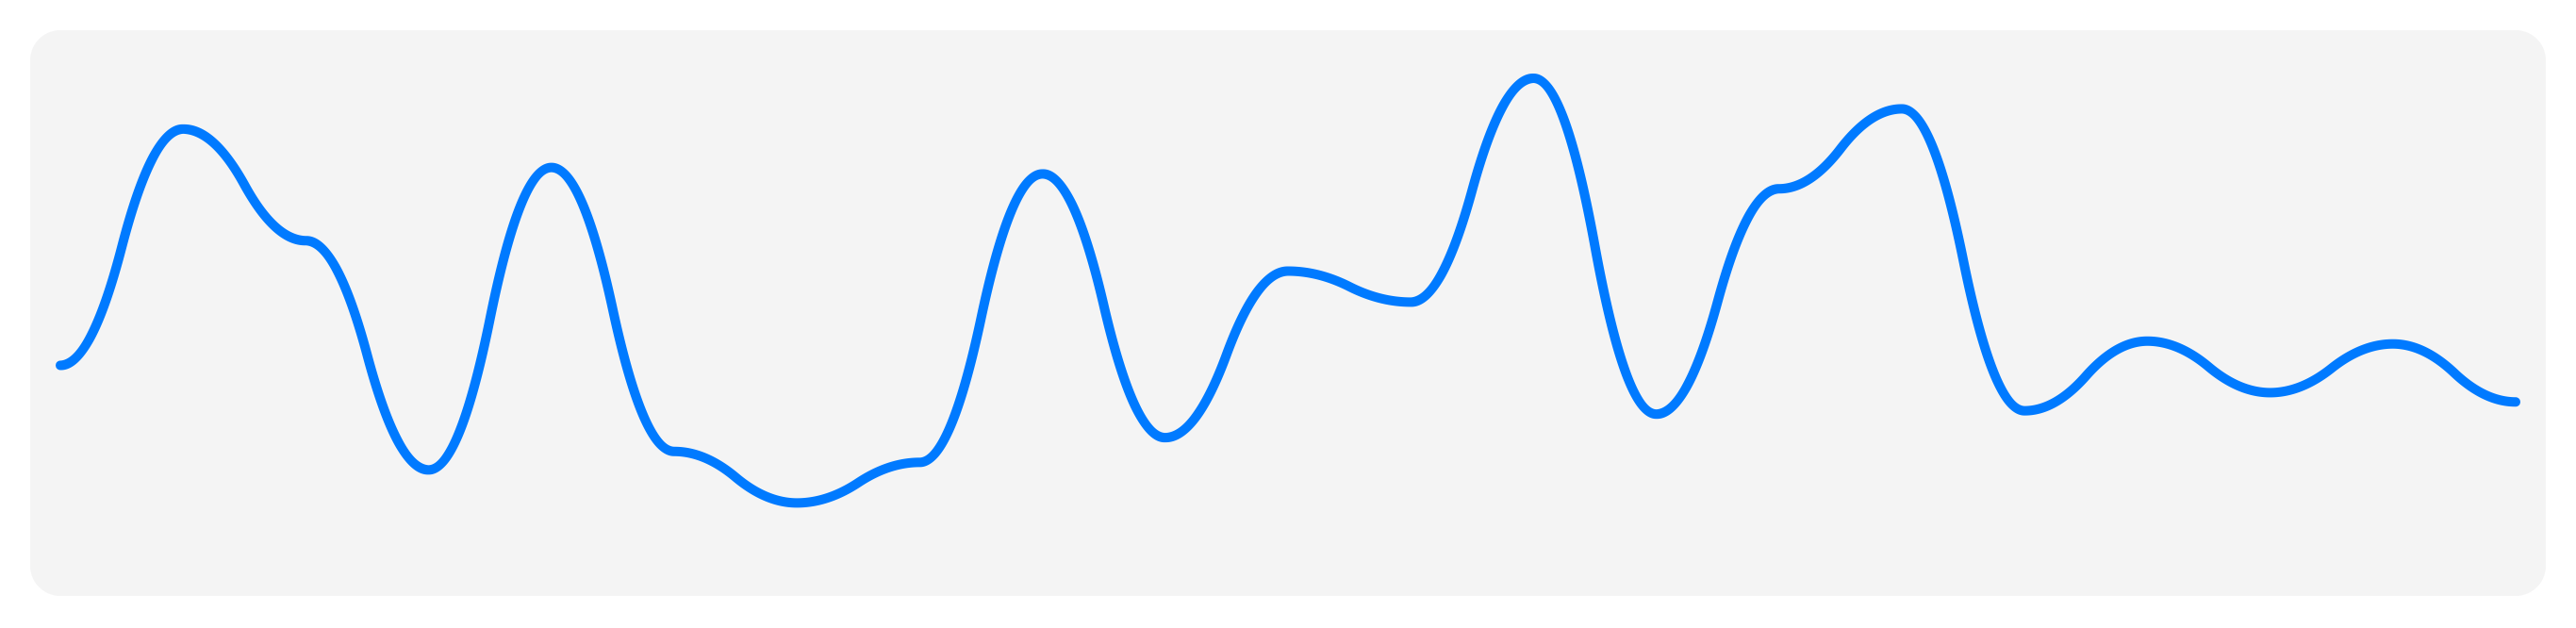
Chart(data: [0.1, 0.3, 0.2, 0.5, 0.4, 0.9, 0.1])
    .chartStyle(
        LineChartStyle(.quadCurve, lineColor: .blue, lineWidth: 5)
    )
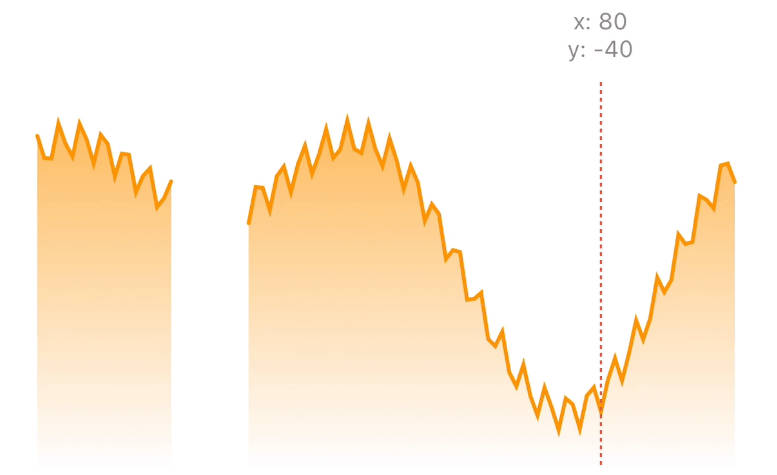
Area
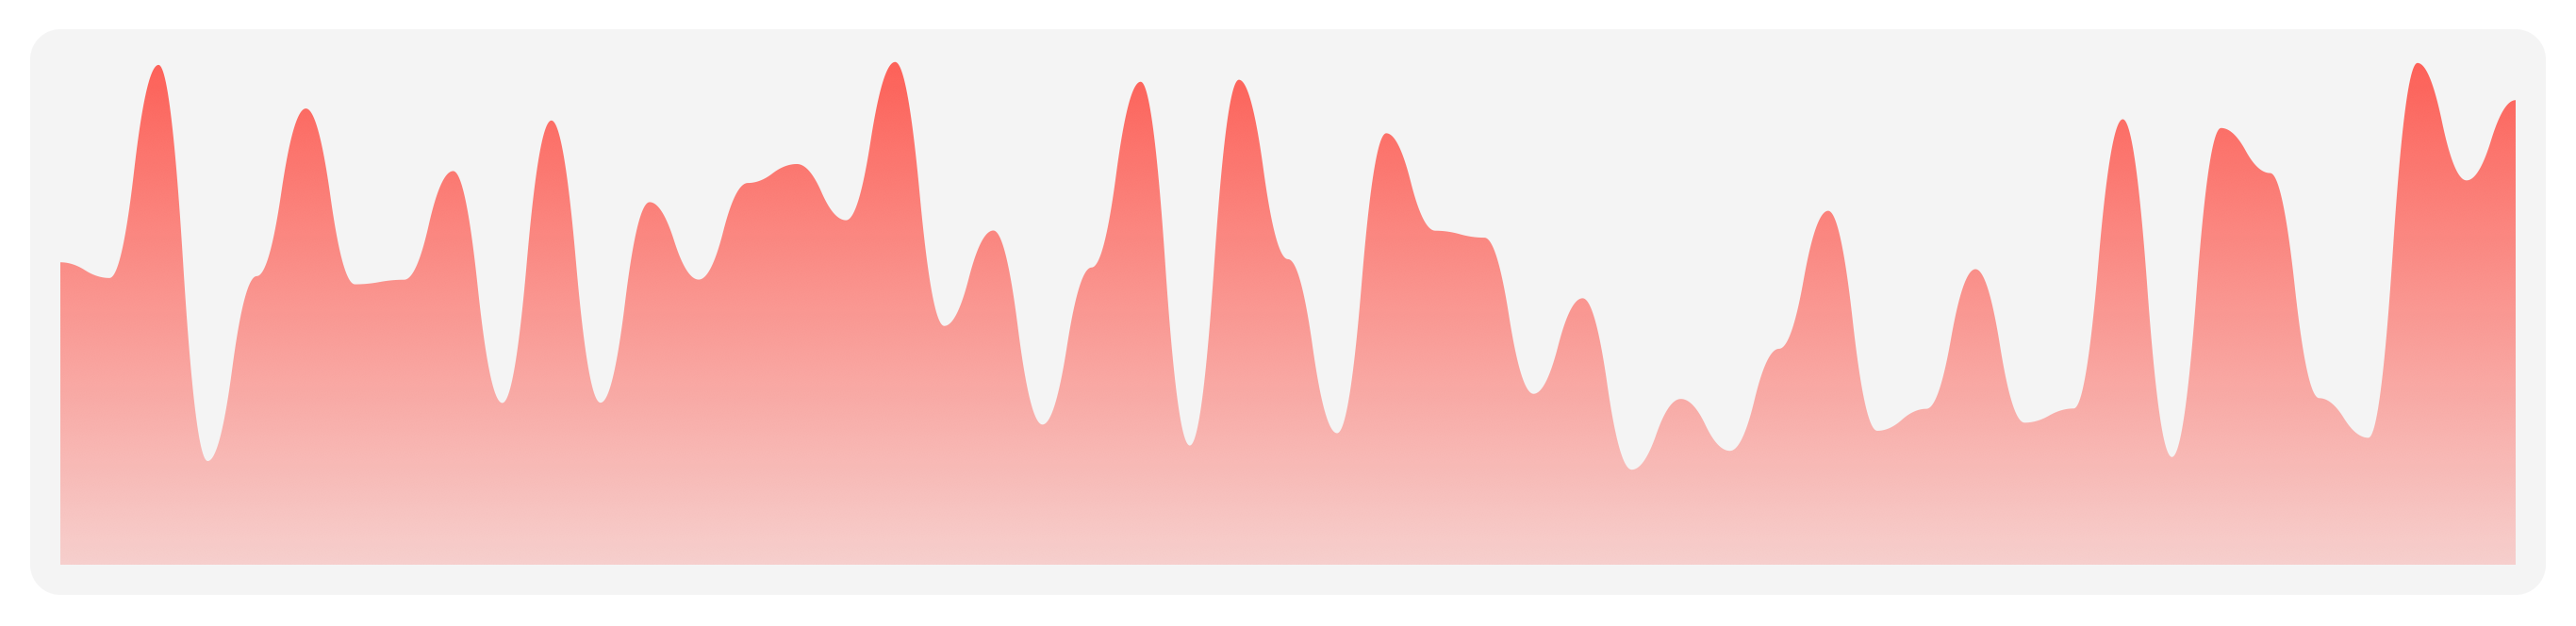
Chart(data: [0.1, 0.3, 0.2, 0.5, 0.4, 0.9, 0.1])
    .chartStyle(
        AreaChartStyle(.quadCurve, fill:
            LinearGradient(gradient: .init(colors: [Color.blue.opacity(0.2), Color.blue.opacity(0.05)]), startPoint: .top, endPoint: .bottom)
        )
    )
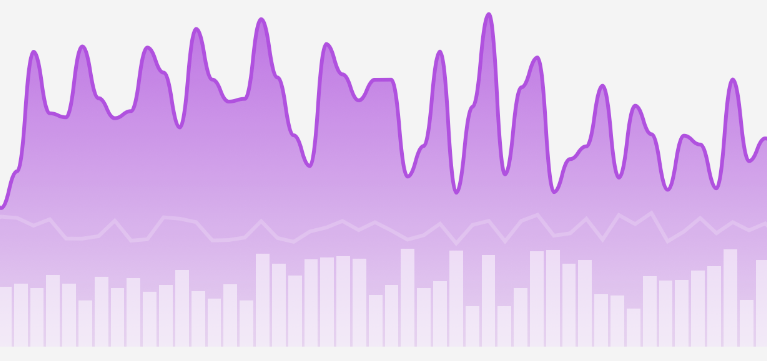
Stacked Area
Chart(data: matrix)
    .chartStyle(
        StackedAreaChartStyle(.quadCurve, colors: [.yellow, .orange, .red])
    )
Column
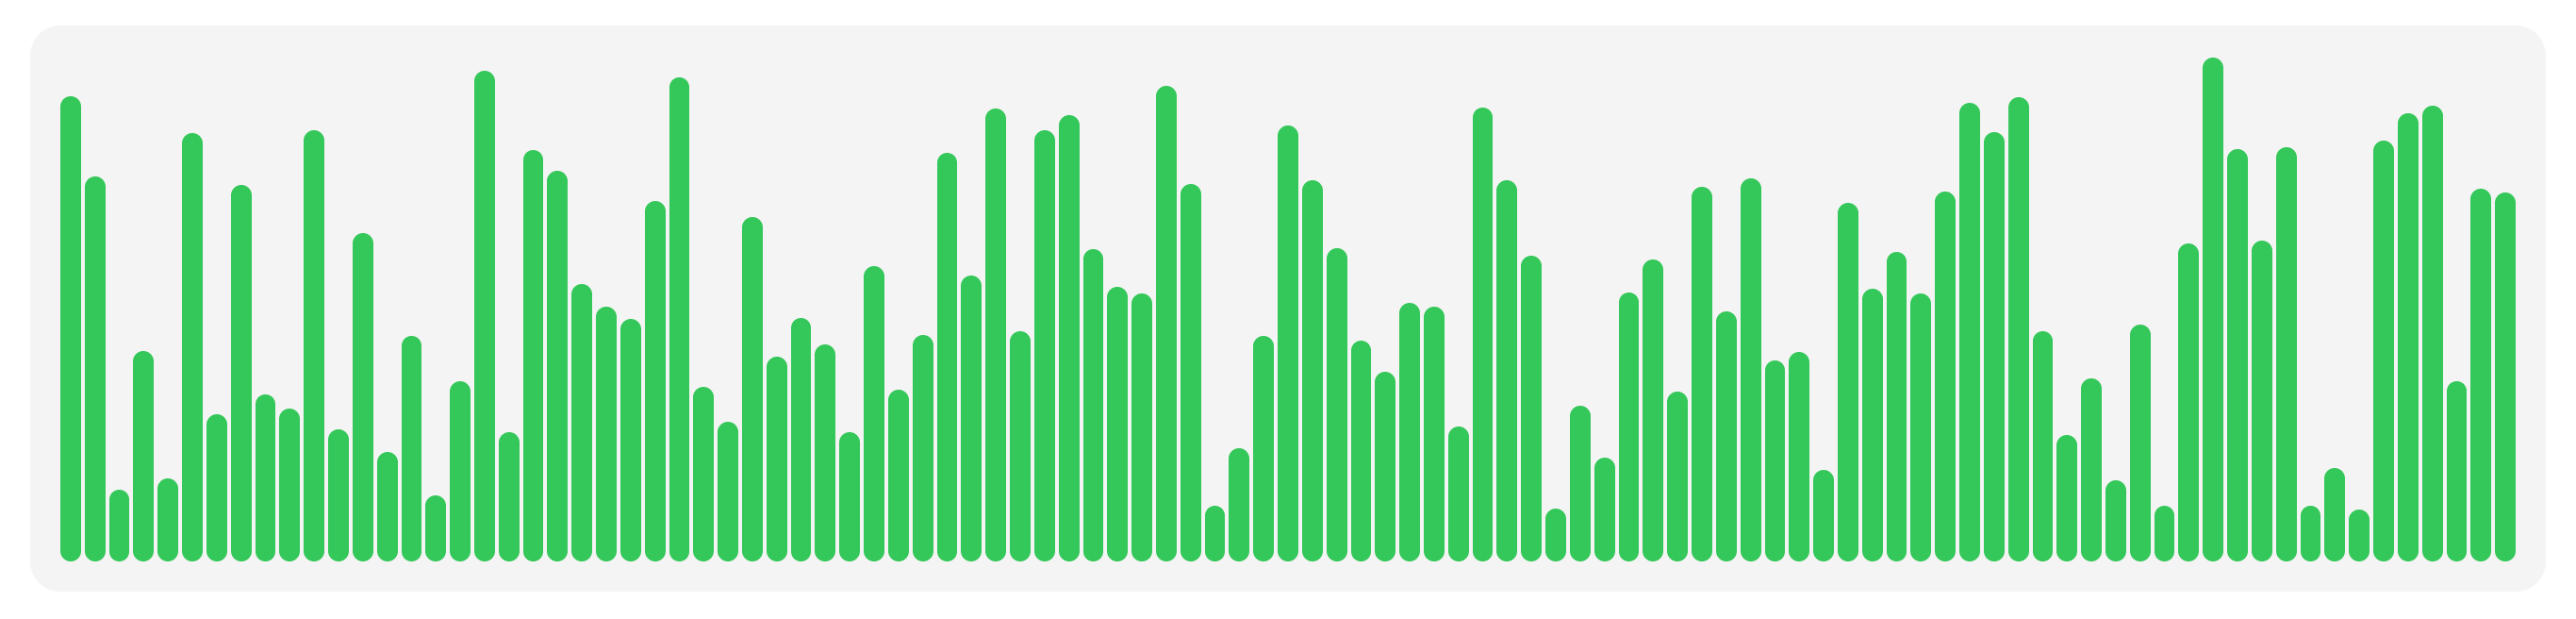
Chart(data: [0.1, 0.3, 0.2, 0.5, 0.4, 0.9, 0.1])
    .chartStyle(
        ColumnChartStyle(column: Capsule().foregroundColor(.green), spacing: 2)
    )
Stacked Column
Chart(data: matrix)
    .chartStyle(
        StackedColumnChartStyle(spacing: 2, colors: [.yellow, .orange, .red])
    )
SDKs
- iOS 13+
- Mac Catalyst 13.0+
- macOS 10.15+
- watchOS 6+
- Xcode 12.0+
Roadmap
- Bar chart style
Code Contributions
Feel free to contribute via fork/pull request to master branch. If you want to request a feature or report a bug please start a new issue.
Coffee Contributions
If you find this project useful please consider becoming my GitHub sponsor.